

above room temperature range is used to study molecular relaxation, state transition, phase separation, polymorphism, and shelf
stability of the freeze-dried products.
1.2 Interpretation of
a Calorimetrical
Thermogram
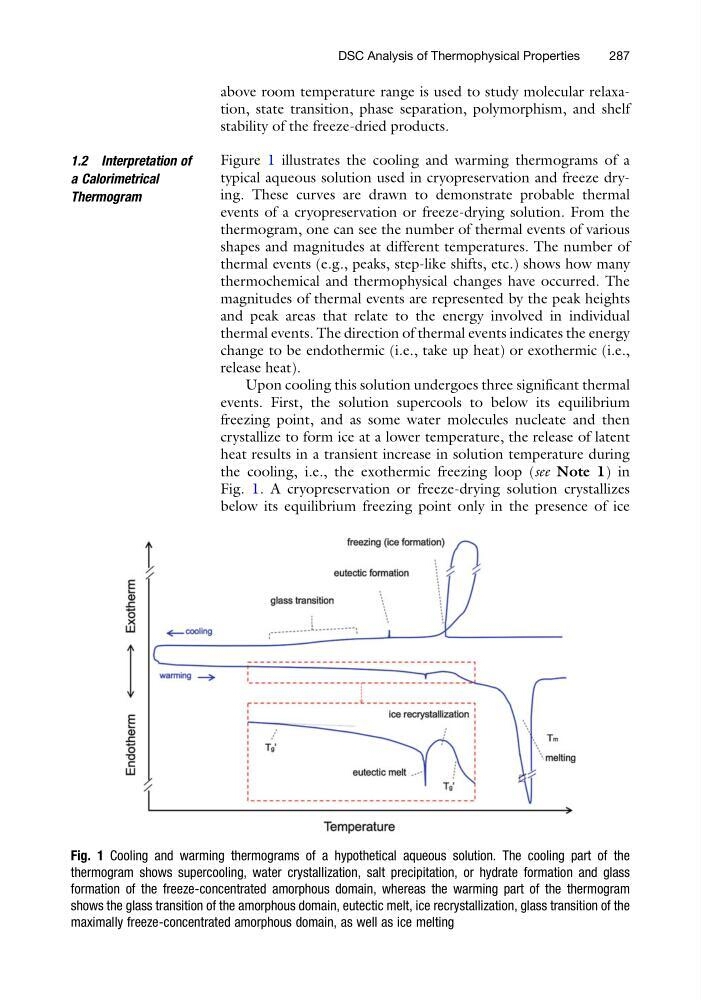
Figure 1 illustrates the cooling and warming thermograms of a
typical aqueous solution used in cryopreservation and freeze drying. These curves are drawn to demonstrate probable thermal
events of a cryopreservation or freeze-drying solution. From the
thermogram, one can see the number of thermal events of various
shapes and magnitudes at different temperatures. The number of
thermal events (e.g., peaks, step-like shifts, etc.) shows how many
thermochemical and thermophysical changes have occurred. The
magnitudes of thermal events are represented by the peak heights
and peak areas that relate to the energy involved in individual
thermal events. The direction of thermal events indicates the energy
change to be endothermic (i.e., take up heat) or exothermic (i.e.,
release heat).
Upon cooling this solution undergoes three significant thermal
events. First, the solution supercools to below its equilibrium
freezing point, and as some water molecules nucleate and then
crystallize to form ice at a lower temperature, the release of latent
heat results in a transient increase in solution temperature during
the cooling, i.e., the exothermic freezing loop (see Note 1) in
Fig. 1. A cryopreservation or freeze-drying solution crystallizes
below its equilibrium freezing point only in the presence of ice
Fig. 1 Cooling and warming thermograms of a hypothetical aqueous solution. The cooling part of the
thermogram shows supercooling, water crystallization, salt precipitation, or hydrate formation and glass
formation of the freeze-concentrated amorphous domain, whereas the warming part of the thermogram
shows the glass transition of the amorphous domain, eutectic melt, ice recrystallization, glass transition of the
maximally freeze-concentrated amorphous domain, as well as ice melting
DSC Analysis of Thermophysical Properties
287
stability of the freeze-dried products.
1.2 Interpretation of
a Calorimetrical
Thermogram
Figure 1 illustrates the cooling and warming thermograms of a
typical aqueous solution used in cryopreservation and freeze drying. These curves are drawn to demonstrate probable thermal
events of a cryopreservation or freeze-drying solution. From the
thermogram, one can see the number of thermal events of various
shapes and magnitudes at different temperatures. The number of
thermal events (e.g., peaks, step-like shifts, etc.) shows how many
thermochemical and thermophysical changes have occurred. The
magnitudes of thermal events are represented by the peak heights
and peak areas that relate to the energy involved in individual
thermal events. The direction of thermal events indicates the energy
change to be endothermic (i.e., take up heat) or exothermic (i.e.,
release heat).
Upon cooling this solution undergoes three significant thermal
events. First, the solution supercools to below its equilibrium
freezing point, and as some water molecules nucleate and then
crystallize to form ice at a lower temperature, the release of latent
heat results in a transient increase in solution temperature during
the cooling, i.e., the exothermic freezing loop (see Note 1) in
Fig. 1. A cryopreservation or freeze-drying solution crystallizes
below its equilibrium freezing point only in the presence of ice
Fig. 1 Cooling and warming thermograms of a hypothetical aqueous solution. The cooling part of the
thermogram shows supercooling, water crystallization, salt precipitation, or hydrate formation and glass
formation of the freeze-concentrated amorphous domain, whereas the warming part of the thermogram
shows the glass transition of the amorphous domain, eutectic melt, ice recrystallization, glass transition of the
maximally freeze-concentrated amorphous domain, as well as ice melting
DSC Analysis of Thermophysical Properties
287