

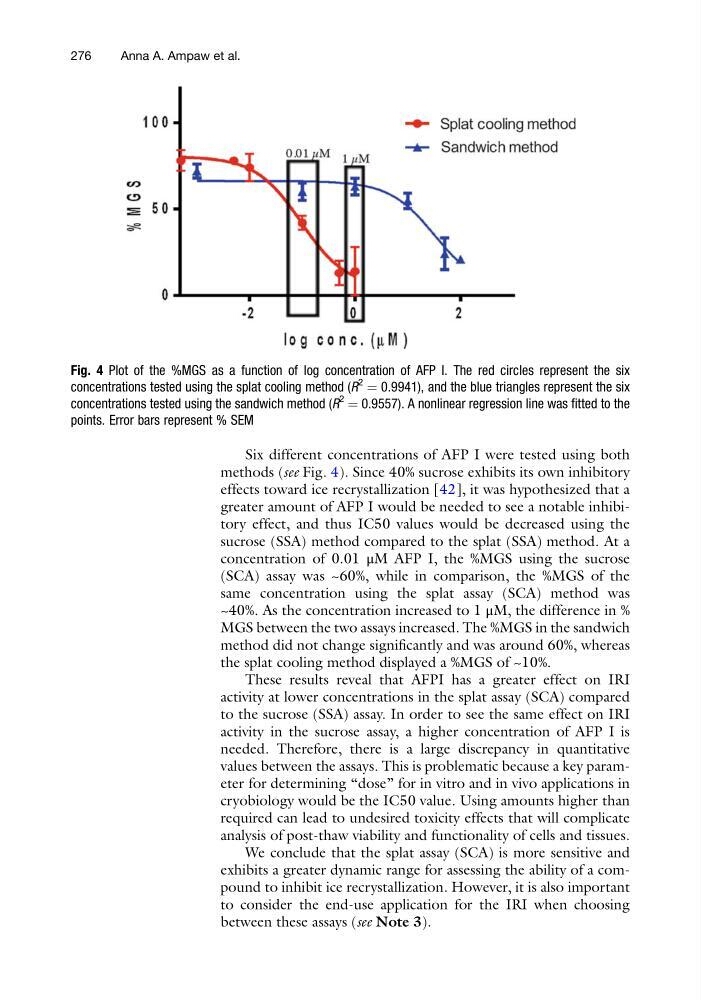
Six different concentrations of AFP I were tested using both
methods (see Fig. 4). Since 40% sucrose exhibits its own inhibitory
effects toward ice recrystallization [42], it was hypothesized that a
greater amount of AFP I would be needed to see a notable inhibitory effect, and thus IC50 values would be decreased using the
sucrose (SSA) method compared to the splat (SSA) method. At a
concentration of 0.01 μM AFP I, the %MGS using the sucrose
(SCA) assay was ~60%, while in comparison, the %MGS of the
same concentration using the splat assay (SCA) method was
~40%. As the concentration increased to 1 μM, the difference in %
MGS between the two assays increased. The %MGS in the sandwich
method did not change significantly and was around 60%, whereas
the splat cooling method displayed a %MGS of ~10%.
These results reveal that AFPI has a greater effect on IRI
activity at lower concentrations in the splat assay (SCA) compared
to the sucrose (SSA) assay. In order to see the same effect on IRI
activity in the sucrose assay, a higher concentration of AFP I is
needed. Therefore, there is a large discrepancy in quantitative
values between the assays. This is problematic because a key parameter for determining “dose” for in vitro and in vivo applications in
cryobiology would be the IC50 value. Using amounts higher than
required can lead to undesired toxicity effects that will complicate
analysis of post-thaw viability and functionality of cells and tissues.
We conclude that the splat assay (SCA) is more sensitive and
exhibits a greater dynamic range for assessing the ability of a compound to inhibit ice recrystallization. However, it is also important
to consider the end-use application for the IRI when choosing
between these assays (see Note 3).
Fig. 4 Plot of the %MGS as a function of log concentration of AFP I. The red circles represent the six
concentrations tested using the splat cooling method (R
2
¼ 0.9941), and the blue triangles represent the six
concentrations tested using the sandwich method (R
2
¼ 0.9557). A nonlinear regression line was fitted to the
points. Error bars represent % SEM
276
Anna A. Ampaw et al.
methods (see Fig. 4). Since 40% sucrose exhibits its own inhibitory
effects toward ice recrystallization [42], it was hypothesized that a
greater amount of AFP I would be needed to see a notable inhibitory effect, and thus IC50 values would be decreased using the
sucrose (SSA) method compared to the splat (SSA) method. At a
concentration of 0.01 μM AFP I, the %MGS using the sucrose
(SCA) assay was ~60%, while in comparison, the %MGS of the
same concentration using the splat assay (SCA) method was
~40%. As the concentration increased to 1 μM, the difference in %
MGS between the two assays increased. The %MGS in the sandwich
method did not change significantly and was around 60%, whereas
the splat cooling method displayed a %MGS of ~10%.
These results reveal that AFPI has a greater effect on IRI
activity at lower concentrations in the splat assay (SCA) compared
to the sucrose (SSA) assay. In order to see the same effect on IRI
activity in the sucrose assay, a higher concentration of AFP I is
needed. Therefore, there is a large discrepancy in quantitative
values between the assays. This is problematic because a key parameter for determining “dose” for in vitro and in vivo applications in
cryobiology would be the IC50 value. Using amounts higher than
required can lead to undesired toxicity effects that will complicate
analysis of post-thaw viability and functionality of cells and tissues.
We conclude that the splat assay (SCA) is more sensitive and
exhibits a greater dynamic range for assessing the ability of a compound to inhibit ice recrystallization. However, it is also important
to consider the end-use application for the IRI when choosing
between these assays (see Note 3).
Fig. 4 Plot of the %MGS as a function of log concentration of AFP I. The red circles represent the six
concentrations tested using the splat cooling method (R
2
¼ 0.9941), and the blue triangles represent the six
concentrations tested using the sandwich method (R
2
¼ 0.9557). A nonlinear regression line was fitted to the
points. Error bars represent % SEM
276
Anna A. Ampaw et al.