

In an attempt to directly compare the effect of the standard
solution in each assay, PBS was used as the standard solution in the
sucrose sandwich method (see Note 2). To further investigate the
differences between both assays, the ice crystal size as a function of
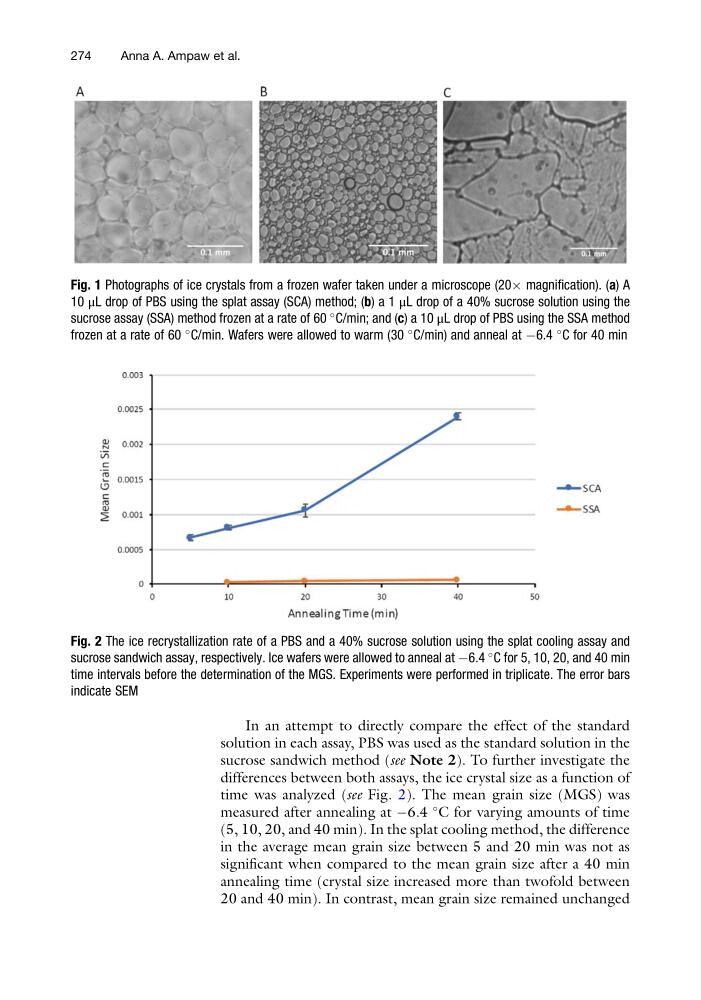
time was analyzed (see Fig. 2). The mean grain size (MGS) was
measured after annealing at À6.4
C for varying amounts of time
(5, 10, 20, and 40 min). In the splat cooling method, the difference
in the average mean grain size between 5 and 20 min was not as
significant when compared to the mean grain size after a 40 min
annealing time (crystal size increased more than twofold between
20 and 40 min). In contrast, mean grain size remained unchanged
Fig. 1 Photographs of ice crystals from a frozen wafer taken under a microscope (20Â magnification). (a) A
10 μL drop of PBS using the splat assay (SCA) method; (b) a 1 μL drop of a 40% sucrose solution using the
sucrose assay (SSA) method frozen at a rate of 60
C/min; and (c) a 10 μL drop of PBS using the SSA method
frozen at a rate of 60
C/min. Wafers were allowed to warm (30
C/min) and anneal at À6.4
C for 40 min
Fig. 2 The ice recrystallization rate of a PBS and a 40% sucrose solution using the splat cooling assay and
sucrose sandwich assay, respectively. Ice wafers were allowed to anneal at À6.4
C for 5, 10, 20, and 40 min
time intervals before the determination of the MGS. Experiments were performed in triplicate. The error bars
indicate SEM
274
Anna A. Ampaw et al.
solution in each assay, PBS was used as the standard solution in the
sucrose sandwich method (see Note 2). To further investigate the
differences between both assays, the ice crystal size as a function of
time was analyzed (see Fig. 2). The mean grain size (MGS) was
measured after annealing at À6.4
C for varying amounts of time
(5, 10, 20, and 40 min). In the splat cooling method, the difference
in the average mean grain size between 5 and 20 min was not as
significant when compared to the mean grain size after a 40 min
annealing time (crystal size increased more than twofold between
20 and 40 min). In contrast, mean grain size remained unchanged
Fig. 1 Photographs of ice crystals from a frozen wafer taken under a microscope (20Â magnification). (a) A
10 μL drop of PBS using the splat assay (SCA) method; (b) a 1 μL drop of a 40% sucrose solution using the
sucrose assay (SSA) method frozen at a rate of 60
C/min; and (c) a 10 μL drop of PBS using the SSA method
frozen at a rate of 60
C/min. Wafers were allowed to warm (30
C/min) and anneal at À6.4
C for 40 min
Fig. 2 The ice recrystallization rate of a PBS and a 40% sucrose solution using the splat cooling assay and
sucrose sandwich assay, respectively. Ice wafers were allowed to anneal at À6.4
C for 5, 10, 20, and 40 min
time intervals before the determination of the MGS. Experiments were performed in triplicate. The error bars
indicate SEM
274
Anna A. Ampaw et al.