

osmolality. This is evident as a characteristic biphasic cell volume
response during exposure to a solution with permeating CPAs (see
Fig. 5b, d).
The biphasic cell volume response can be captured by transport
equations describing the cell membrane permeability for water
(Lp) and that of the solute (Ps). Different formalisms are available
to fit cell volume response data. Briefly, these include the so-called
one-parameter or solute permeability model [60], the
two-parameter model in which water and solute transport are
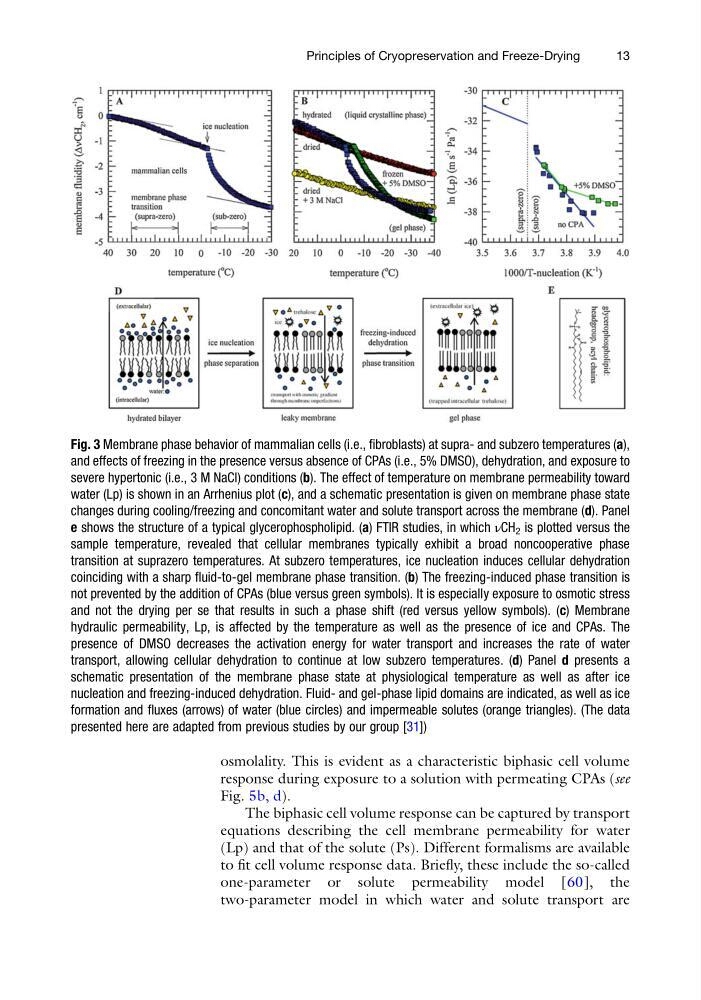
Fig. 3 Membrane phase behavior of mammalian cells (i.e., fibroblasts) at supra- and subzero temperatures (a),
and effects of freezing in the presence versus absence of CPAs (i.e., 5% DMSO), dehydration, and exposure to
severe hypertonic (i.e., 3 M NaCl) conditions (b). The effect of temperature on membrane permeability toward
water (Lp) is shown in an Arrhenius plot (c), and a schematic presentation is given on membrane phase state
changes during cooling/freezing and concomitant water and solute transport across the membrane (d). Panel
e shows the structure of a typical glycerophospholipid. (a) FTIR studies, in which νCH 2 is plotted versus the
sample temperature, revealed that cellular membranes typically exhibit a broad noncooperative phase
transition at suprazero temperatures. At subzero temperatures, ice nucleation induces cellular dehydration
coinciding with a sharp fluid-to-gel membrane phase transition. (b) The freezing-induced phase transition is
not prevented by the addition of CPAs (blue versus green symbols). It is especially exposure to osmotic stress
and not the drying per se that results in such a phase shift (red versus yellow symbols). (c) Membrane
hydraulic permeability, Lp, is affected by the temperature as well as the presence of ice and CPAs. The
presence of DMSO decreases the activation energy for water transport and increases the rate of water
transport, allowing cellular dehydration to continue at low subzero temperatures. (d) Panel d presents a
schematic presentation of the membrane phase state at physiological temperature as well as after ice
nucleation and freezing-induced dehydration. Fluid- and gel-phase lipid domains are indicated, as well as ice
formation and fluxes (arrows) of water (blue circles) and impermeable solutes (orange triangles). (The data
presented here are adapted from previous studies by our group [31])
Principles of Cryopreservation and Freeze-Drying
13
response during exposure to a solution with permeating CPAs (see
Fig. 5b, d).
The biphasic cell volume response can be captured by transport
equations describing the cell membrane permeability for water
(Lp) and that of the solute (Ps). Different formalisms are available
to fit cell volume response data. Briefly, these include the so-called
one-parameter or solute permeability model [60], the
two-parameter model in which water and solute transport are
Fig. 3 Membrane phase behavior of mammalian cells (i.e., fibroblasts) at supra- and subzero temperatures (a),
and effects of freezing in the presence versus absence of CPAs (i.e., 5% DMSO), dehydration, and exposure to
severe hypertonic (i.e., 3 M NaCl) conditions (b). The effect of temperature on membrane permeability toward
water (Lp) is shown in an Arrhenius plot (c), and a schematic presentation is given on membrane phase state
changes during cooling/freezing and concomitant water and solute transport across the membrane (d). Panel
e shows the structure of a typical glycerophospholipid. (a) FTIR studies, in which νCH 2 is plotted versus the
sample temperature, revealed that cellular membranes typically exhibit a broad noncooperative phase
transition at suprazero temperatures. At subzero temperatures, ice nucleation induces cellular dehydration
coinciding with a sharp fluid-to-gel membrane phase transition. (b) The freezing-induced phase transition is
not prevented by the addition of CPAs (blue versus green symbols). It is especially exposure to osmotic stress
and not the drying per se that results in such a phase shift (red versus yellow symbols). (c) Membrane
hydraulic permeability, Lp, is affected by the temperature as well as the presence of ice and CPAs. The
presence of DMSO decreases the activation energy for water transport and increases the rate of water
transport, allowing cellular dehydration to continue at low subzero temperatures. (d) Panel d presents a
schematic presentation of the membrane phase state at physiological temperature as well as after ice
nucleation and freezing-induced dehydration. Fluid- and gel-phase lipid domains are indicated, as well as ice
formation and fluxes (arrows) of water (blue circles) and impermeable solutes (orange triangles). (The data
presented here are adapted from previous studies by our group [31])
Principles of Cryopreservation and Freeze-Drying
13