

thread the black siphon capillary tube into the coolant inlet
pipe, and then slide the white plastic connector over the inlet
pipe, using a twisting motion. At this point, the system configuration should correspond to the schematic shown in Fig. 2.
14. Using the Linksys32 software Temperature Control Panel, set
the LNP control to automatic mode.
15. Modify the first row of the temperature profile (see Note 39) to
set stage temperature to the desired sample loading temperature (see Note 40), with an indefinite hold (e.g., set
Limit ¼ 37.0, Time ¼ 99,999).
16. Program the remaining temperature profile ramps required for
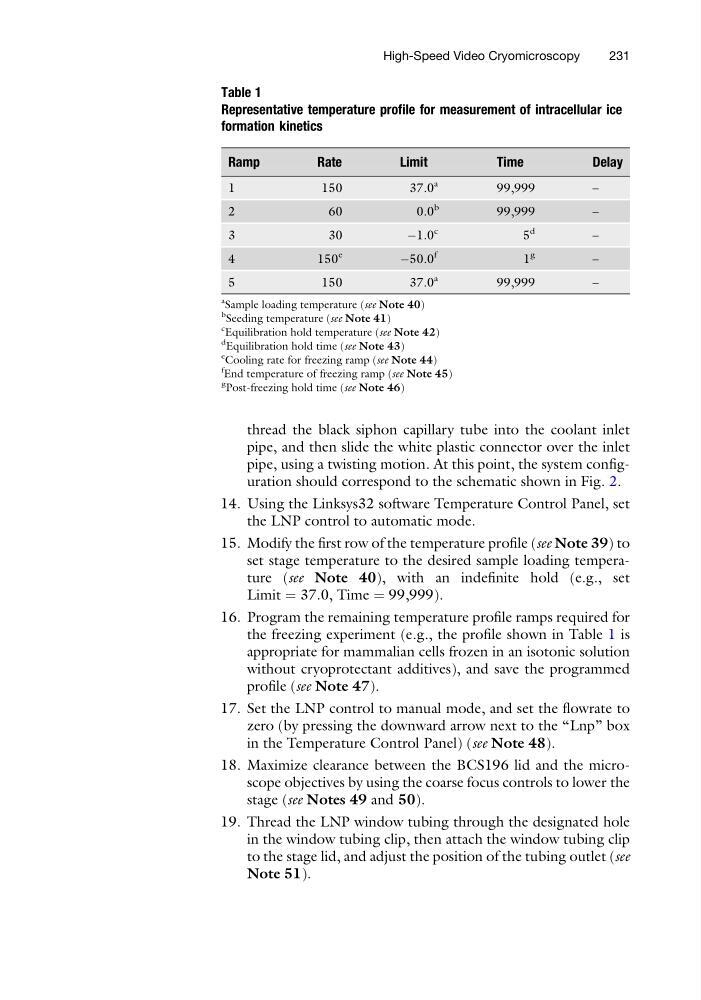
the freezing experiment (e.g., the profile shown in Table 1 is
appropriate for mammalian cells frozen in an isotonic solution
without cryoprotectant additives), and save the programmed
profile (see Note 47).
17. Set the LNP control to manual mode, and set the flowrate to
zero (by pressing the downward arrow next to the “Lnp” box
in the Temperature Control Panel) (see Note 48).
18. Maximize clearance between the BCS196 lid and the microscope objectives by using the coarse focus controls to lower the
stage (see Notes 49 and 50).
19. Thread the LNP window tubing through the designated hole
in the window tubing clip, then attach the window tubing clip
to the stage lid, and adjust the position of the tubing outlet (see
Note 51).
Table 1
Representative temperature profile for measurement of intracellular ice
formation kinetics
Ramp
Rate
Limit
Time
Delay
1
150
37.0
a
99,999
–
2
60
0.0
b
99,999
–
3
3 0
À1.0
c
5
d
–
4
150
e
À50.0
f
1
g
–
5
150
37.0
a
99,999
–
a
Sample loading temperature (see Note 40)
b
Seeding temperature (see Note 41)
c
Equilibration hold temperature (see Note 42)
d
Equilibration hold time (see Note 43)
e
Cooling rate for freezing ramp (see Note 44)
f End temperature of freezing ramp (see Note 45)
g
Post-freezing hold time (see Note 46)
High-Speed Video Cryomicroscopy
231
pipe, and then slide the white plastic connector over the inlet
pipe, using a twisting motion. At this point, the system configuration should correspond to the schematic shown in Fig. 2.
14. Using the Linksys32 software Temperature Control Panel, set
the LNP control to automatic mode.
15. Modify the first row of the temperature profile (see Note 39) to
set stage temperature to the desired sample loading temperature (see Note 40), with an indefinite hold (e.g., set
Limit ¼ 37.0, Time ¼ 99,999).
16. Program the remaining temperature profile ramps required for
the freezing experiment (e.g., the profile shown in Table 1 is
appropriate for mammalian cells frozen in an isotonic solution
without cryoprotectant additives), and save the programmed
profile (see Note 47).
17. Set the LNP control to manual mode, and set the flowrate to
zero (by pressing the downward arrow next to the “Lnp” box
in the Temperature Control Panel) (see Note 48).
18. Maximize clearance between the BCS196 lid and the microscope objectives by using the coarse focus controls to lower the
stage (see Notes 49 and 50).
19. Thread the LNP window tubing through the designated hole
in the window tubing clip, then attach the window tubing clip
to the stage lid, and adjust the position of the tubing outlet (see
Note 51).
Table 1
Representative temperature profile for measurement of intracellular ice
formation kinetics
Ramp
Rate
Limit
Time
Delay
1
150
37.0
a
99,999
–
2
60
0.0
b
99,999
–
3
3 0
À1.0
c
5
d
–
4
150
e
À50.0
f
1
g
–
5
150
37.0
a
99,999
–
a
Sample loading temperature (see Note 40)
b
Seeding temperature (see Note 41)
c
Equilibration hold temperature (see Note 42)
d
Equilibration hold time (see Note 43)
e
Cooling rate for freezing ramp (see Note 44)
f End temperature of freezing ramp (see Note 45)
g
Post-freezing hold time (see Note 46)
High-Speed Video Cryomicroscopy
231