

0
2
4
6
8
10
0
20
40
60
80
100
m i s /m e s
m i s /m e s
m i s /m e s
0.0
0.2
0.4
0.6
0.8
1.0
0
20
40
60
80
2
4
6
8
10
–250
–200
–150
–100
–50
0
% Error
% Error
% Error
a
b
c
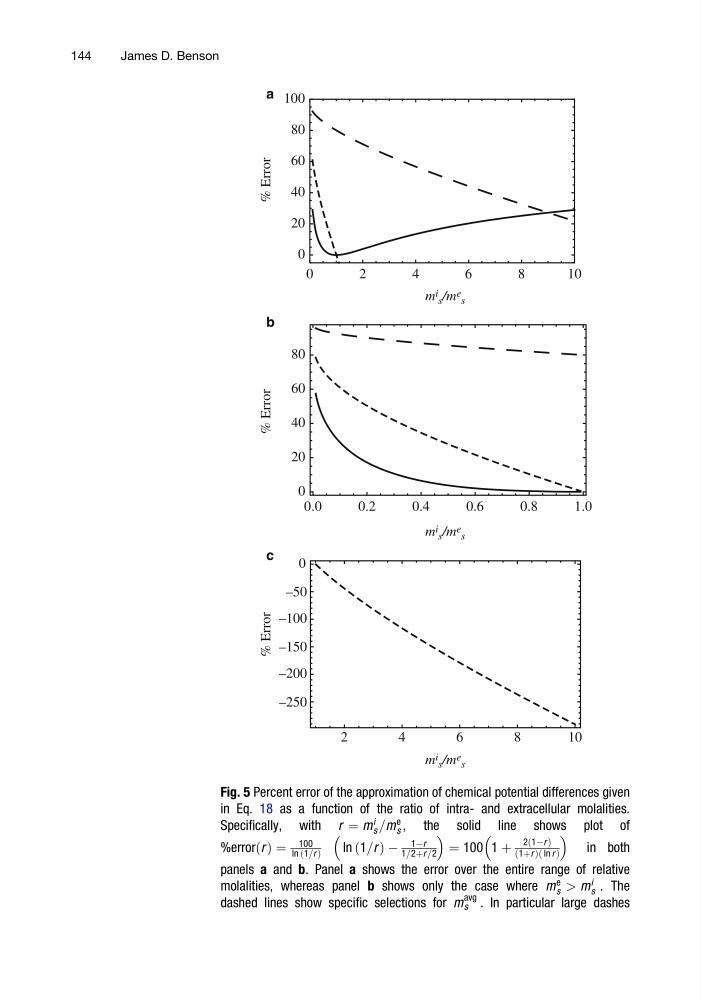
Fig. 5 Percent error of the approximation of chemical potential differences given
in Eq. 18 as a function of the ratio of intra- and extracellular molalities.
Specifically, with r ¼ m
i
s =m
e
s , the solid line shows plot of
%errorðr Þ ¼
100
ln ð1=r Þ
ln ð1=r Þ À
1Àr
1=2þr =2
¼ 100 1 þ
2ð1Àr Þ
ð1þr Þð ln r Þ
in both
panels a and b. Panel a shows the error over the entire range of relative
molalities, whereas panel b shows only the case where m
e
s > m
i
s . The
dashed lines show specific selections for m
avg
s . In particular large dashes
144
James D. Benson
2
4
6
8
10
0
20
40
60
80
100
m i s /m e s
m i s /m e s
m i s /m e s
0.0
0.2
0.4
0.6
0.8
1.0
0
20
40
60
80
2
4
6
8
10
–250
–200
–150
–100
–50
0
% Error
% Error
% Error
a
b
c
Fig. 5 Percent error of the approximation of chemical potential differences given
in Eq. 18 as a function of the ratio of intra- and extracellular molalities.
Specifically, with r ¼ m
i
s =m
e
s , the solid line shows plot of
%errorðr Þ ¼
100
ln ð1=r Þ
ln ð1=r Þ À
1Àr
1=2þr =2
¼ 100 1 þ
2ð1Àr Þ
ð1þr Þð ln r Þ
in both
panels a and b. Panel a shows the error over the entire range of relative
molalities, whereas panel b shows only the case where m
e
s > m
i
s . The
dashed lines show specific selections for m
avg
s . In particular large dashes
144
James D. Benson