

–0.01
–0.02
–0.03
–0.04
Rev Heat Flow (W/g)
–19.16ºC(I)
–0.1
Nonrev Heat Flow (W/g)
–21.53ºC(I)
–21.15ºC(I)
Heat Flow (W/g)
–0.1
–0.2
–80
Exo Up
Temperature (ºC)
Universal V4.5A TA Instruments
–60
–40
–20
0
20
Method Log:
1: Isothermal for 2.00 min
2: Ramp 10.00ºC/min to –90.00ºC
3: Mark end of cycle 1
4: Data storage: Off
5: Modulate +/- 1.00ºC every 60 seconds
6: Isothermal for 8.00 min
7: Data storage: On
8:Sampling interval 1.00 sec/pt
9:Isothermal for 8.00 min
10: Data storage: On
11: Sampling interval 1.00 sec/pt
12: Ramp 3.00ºC/mi to 25.00ºC
13:Mark end of cycle 2
14: End of method
File: C:TA\Data\DSC\2019\300719:001 Run Date: 30–Jul-2019 09:17
Program: Universal V4.5A Run Number: 1
TA Instruments Thermal Analysis – DSC Standard - Modulated RC
–Sample frozen
(plane polarised light)
–27ºC 18µbar sample drying
–21ºC
Collapse
beginning
Sample: heparin ufD ss100
Size: 75.2000 mg
Method: MDSC - 3c minramp 1cmin modulat
File: C:\TA\Data\DSC\2019\300719.001
Operator: pm
Run Date: 30-Jul-2019 09:17
Instrument: DSC Q2000 V24.10 Build 122
DSC
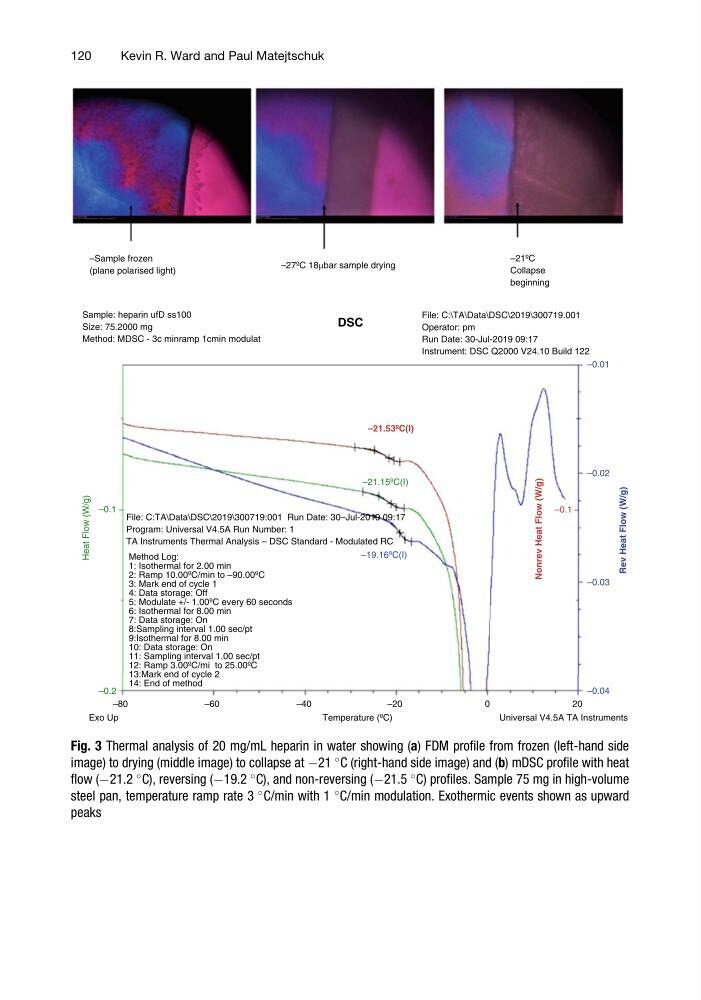
Fig. 3 Thermal analysis of 20 mg/mL heparin in water showing (a) FDM profile from frozen (left-hand side
image) to drying (middle image) to collapse at À21
C (right-hand side image) and (b) mDSC profile with heat
flow (À21.2
C), reversing (À19.2
C), and non-reversing (À21.5
C) profiles. Sample 75 mg in high-volume
steel pan, temperature ramp rate 3
C/min with 1
C/min modulation. Exothermic events shown as upward
peaks
120
Kevin R. Ward and Paul Matejtschuk
–0.02
–0.03
–0.04
Rev Heat Flow (W/g)
–19.16ºC(I)
–0.1
Nonrev Heat Flow (W/g)
–21.53ºC(I)
–21.15ºC(I)
Heat Flow (W/g)
–0.1
–0.2
–80
Exo Up
Temperature (ºC)
Universal V4.5A TA Instruments
–60
–40
–20
0
20
Method Log:
1: Isothermal for 2.00 min
2: Ramp 10.00ºC/min to –90.00ºC
3: Mark end of cycle 1
4: Data storage: Off
5: Modulate +/- 1.00ºC every 60 seconds
6: Isothermal for 8.00 min
7: Data storage: On
8:Sampling interval 1.00 sec/pt
9:Isothermal for 8.00 min
10: Data storage: On
11: Sampling interval 1.00 sec/pt
12: Ramp 3.00ºC/mi to 25.00ºC
13:Mark end of cycle 2
14: End of method
File: C:TA\Data\DSC\2019\300719:001 Run Date: 30–Jul-2019 09:17
Program: Universal V4.5A Run Number: 1
TA Instruments Thermal Analysis – DSC Standard - Modulated RC
–Sample frozen
(plane polarised light)
–27ºC 18µbar sample drying
–21ºC
Collapse
beginning
Sample: heparin ufD ss100
Size: 75.2000 mg
Method: MDSC - 3c minramp 1cmin modulat
File: C:\TA\Data\DSC\2019\300719.001
Operator: pm
Run Date: 30-Jul-2019 09:17
Instrument: DSC Q2000 V24.10 Build 122
DSC
Fig. 3 Thermal analysis of 20 mg/mL heparin in water showing (a) FDM profile from frozen (left-hand side
image) to drying (middle image) to collapse at À21
C (right-hand side image) and (b) mDSC profile with heat
flow (À21.2
C), reversing (À19.2
C), and non-reversing (À21.5
C) profiles. Sample 75 mg in high-volume
steel pan, temperature ramp rate 3
C/min with 1
C/min modulation. Exothermic events shown as upward
peaks
120
Kevin R. Ward and Paul Matejtschuk