

2.5 Infrared and Raman Spectra
79
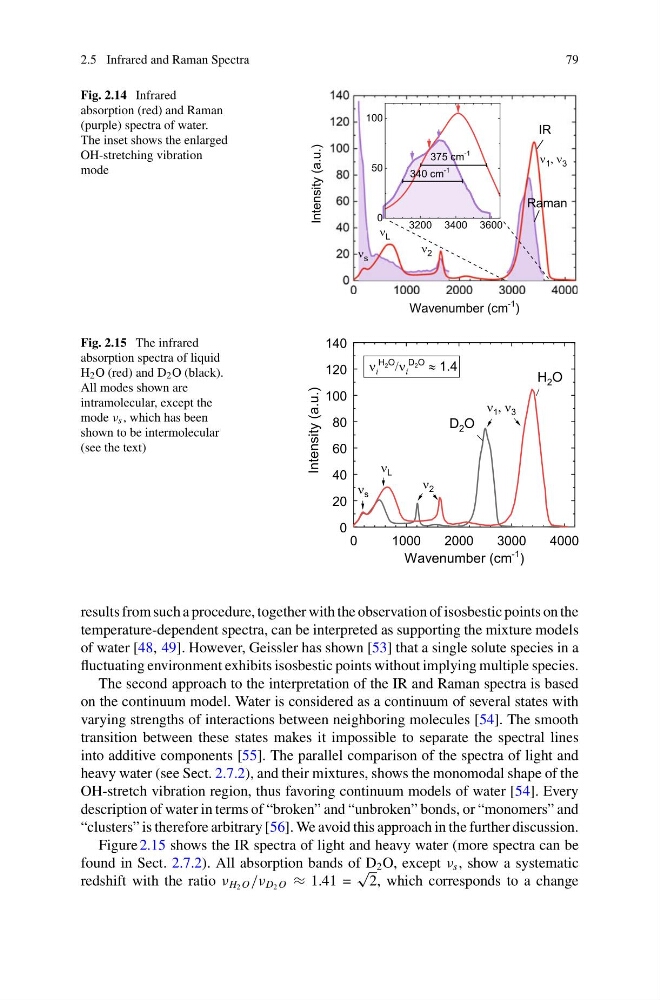
Fig. 2.14 Infrared
absorption (red) and Raman
(purple) spectra of water.
The inset shows the enlarged
OH-stretching vibration
mode
Fig. 2.15 The infrared
absorption spectra of liquid
H 2 O (red) and D 2 O (black).
All modes shown are
intramolecular, except the
mode ν s , which has been
shown to be intermolecular
(see the text)
results from such a procedure, together with the observation of isosbestic points on the
temperature-dependent spectra, can be interpreted as supporting the mixture models
of water [48, 49]. However, Geissler has shown [53] that a single solute species in a
fluctuating environment exhibits isosbestic points without implying multiple species.
The second approach to the interpretation of the IR and Raman spectra is based
on the continuum model. Water is considered as a continuum of several states with
varying strengths of interactions between neighboring molecules [54]. The smooth
transition between these states makes it impossible to separate the spectral lines
into additive components [55]. The parallel comparison of the spectra of light and
heavy water (see Sect. 2.7.2), and their mixtures, shows the monomodal shape of the
OH-stretch vibration region, thus favoring continuum models of water [54]. Every
description of water in terms of “broken” and “unbroken” bonds, or “monomers” and
“clusters” is therefore arbitrary [56]. We avoid this approach in the further discussion.
Figure 2.15 shows the IR spectra of light and heavy water (more spectra can be
found in Sect. 2.7.2). All absorption bands of D 2 O, except ν s , show a systematic
redshift with the ratio ν H 2 O /ν D 2 O ≈ 1.41 =
√
2, which corresponds to a change
79
Fig. 2.14 Infrared
absorption (red) and Raman
(purple) spectra of water.
The inset shows the enlarged
OH-stretching vibration
mode
Fig. 2.15 The infrared
absorption spectra of liquid
H 2 O (red) and D 2 O (black).
All modes shown are
intramolecular, except the
mode ν s , which has been
shown to be intermolecular
(see the text)
results from such a procedure, together with the observation of isosbestic points on the
temperature-dependent spectra, can be interpreted as supporting the mixture models
of water [48, 49]. However, Geissler has shown [53] that a single solute species in a
fluctuating environment exhibits isosbestic points without implying multiple species.
The second approach to the interpretation of the IR and Raman spectra is based
on the continuum model. Water is considered as a continuum of several states with
varying strengths of interactions between neighboring molecules [54]. The smooth
transition between these states makes it impossible to separate the spectral lines
into additive components [55]. The parallel comparison of the spectra of light and
heavy water (see Sect. 2.7.2), and their mixtures, shows the monomodal shape of the
OH-stretch vibration region, thus favoring continuum models of water [54]. Every
description of water in terms of “broken” and “unbroken” bonds, or “monomers” and
“clusters” is therefore arbitrary [56]. We avoid this approach in the further discussion.
Figure 2.15 shows the IR spectra of light and heavy water (more spectra can be
found in Sect. 2.7.2). All absorption bands of D 2 O, except ν s , show a systematic
redshift with the ratio ν H 2 O /ν D 2 O ≈ 1.41 =
√
2, which corresponds to a change