

74
2 The Interaction of Electromagnetic Waves with Water
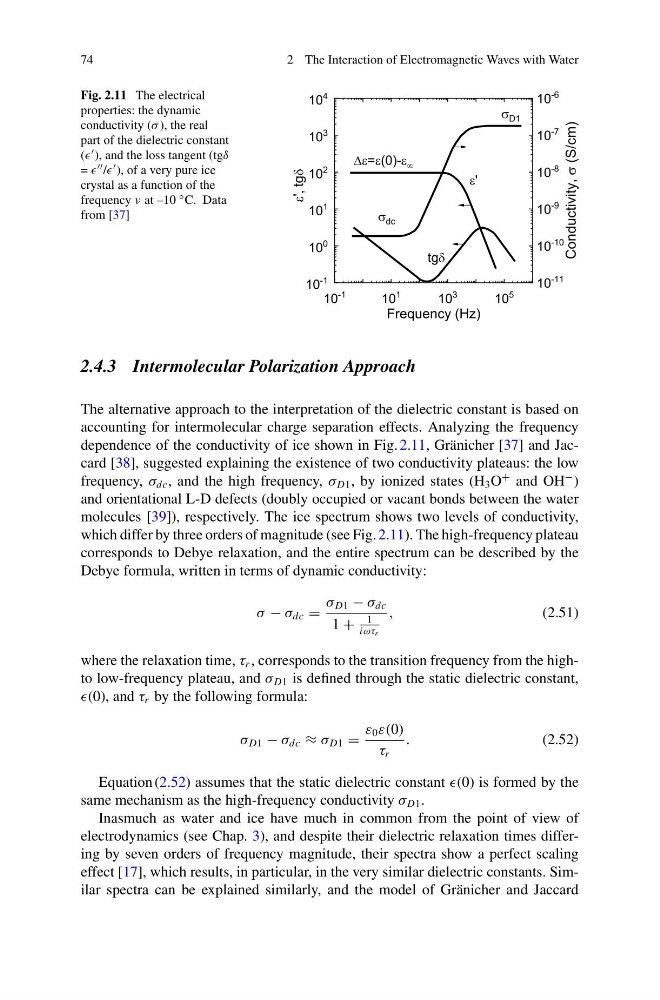
Fig. 2.11 The electrical
properties: the dynamic
conductivity (σ ), the real
part of the dielectric constant
( ), and the loss tangent (tgδ
= / ), of a very pure ice
crystal as a function of the
frequency ν at –10 ◦ C. Data
from [37]
2.4.3 Intermolecular Polarization Approach
The alternative approach to the interpretation of the dielectric constant is based on
accounting for intermolecular charge separation effects. Analyzing the frequency
dependence of the conductivity of ice shown in Fig. 2.11, Gränicher [37] and Jaccard [38], suggested explaining the existence of two conductivity plateaus: the low
frequency, σ dc , and the high frequency, σ D1 , by ionized states (H 3 O
+ and OH
− )
and orientational L-D defects (doubly occupied or vacant bonds between the water
molecules [39]), respectively. The ice spectrum shows two levels of conductivity,
which differ by three orders of magnitude (see Fig. 2.11). The high-frequency plateau
corresponds to Debye relaxation, and the entire spectrum can be described by the
Debye formula, written in terms of dynamic conductivity:
σ − σ dc =
σ D1 − σ dc
1 +
1
iωτ r
,
(2.51)
where the relaxation time, τ r , corresponds to the transition frequency from the highto low-frequency plateau, and σ D1 is defined through the static dielectric constant,
(0), and τ r by the following formula:
σ D1 − σ dc ≈ σ D1 =
ε 0 ε(0)
τ r
.
(2.52)
Equation (2.52) assumes that the static dielectric constant (0) is formed by the
same mechanism as the high-frequency conductivity σ D1 .
Inasmuch as water and ice have much in common from the point of view of
electrodynamics (see Chap. 3), and despite their dielectric relaxation times differing by seven orders of frequency magnitude, their spectra show a perfect scaling
effect [17], which results, in particular, in the very similar dielectric constants. Similar spectra can be explained similarly, and the model of Gränicher and Jaccard
2 The Interaction of Electromagnetic Waves with Water
Fig. 2.11 The electrical
properties: the dynamic
conductivity (σ ), the real
part of the dielectric constant
( ), and the loss tangent (tgδ
= / ), of a very pure ice
crystal as a function of the
frequency ν at –10 ◦ C. Data
from [37]
2.4.3 Intermolecular Polarization Approach
The alternative approach to the interpretation of the dielectric constant is based on
accounting for intermolecular charge separation effects. Analyzing the frequency
dependence of the conductivity of ice shown in Fig. 2.11, Gränicher [37] and Jaccard [38], suggested explaining the existence of two conductivity plateaus: the low
frequency, σ dc , and the high frequency, σ D1 , by ionized states (H 3 O
+ and OH
− )
and orientational L-D defects (doubly occupied or vacant bonds between the water
molecules [39]), respectively. The ice spectrum shows two levels of conductivity,
which differ by three orders of magnitude (see Fig. 2.11). The high-frequency plateau
corresponds to Debye relaxation, and the entire spectrum can be described by the
Debye formula, written in terms of dynamic conductivity:
σ − σ dc =
σ D1 − σ dc
1 +
1
iωτ r
,
(2.51)
where the relaxation time, τ r , corresponds to the transition frequency from the highto low-frequency plateau, and σ D1 is defined through the static dielectric constant,
(0), and τ r by the following formula:
σ D1 − σ dc ≈ σ D1 =
ε 0 ε(0)
τ r
.
(2.52)
Equation (2.52) assumes that the static dielectric constant (0) is formed by the
same mechanism as the high-frequency conductivity σ D1 .
Inasmuch as water and ice have much in common from the point of view of
electrodynamics (see Chap. 3), and despite their dielectric relaxation times differing by seven orders of frequency magnitude, their spectra show a perfect scaling
effect [17], which results, in particular, in the very similar dielectric constants. Similar spectra can be explained similarly, and the model of Gränicher and Jaccard