

70
2 The Interaction of Electromagnetic Waves with Water
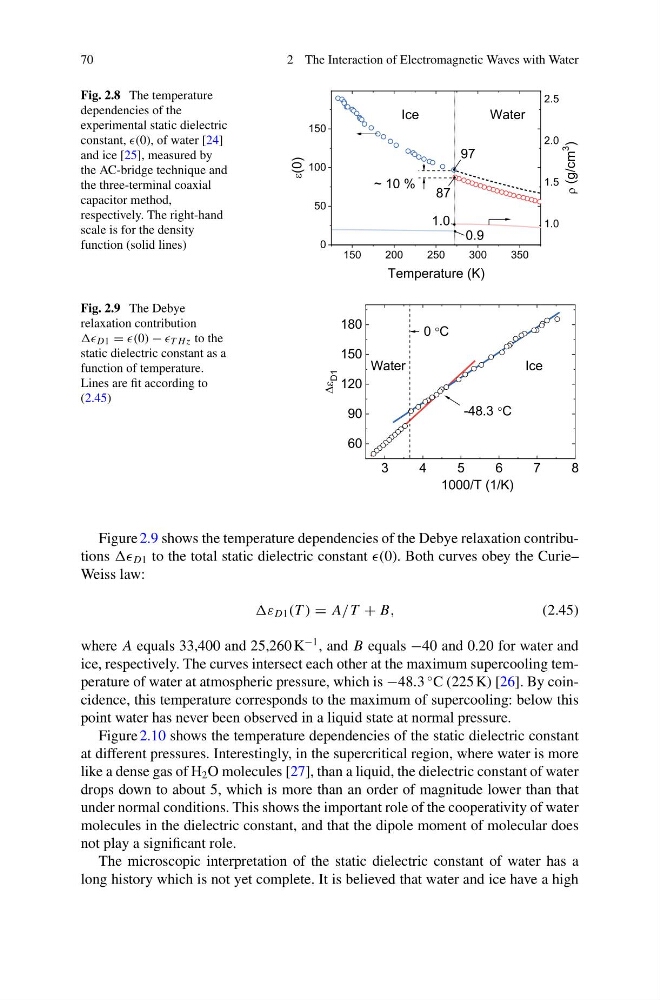
Fig. 2.8 The temperature
dependencies of the
experimental static dielectric
constant, (0), of water [24]
and ice [25], measured by
the AC-bridge technique and
the three-terminal coaxial
capacitor method,
respectively. The right-hand
scale is for the density
function (solid lines)
Fig. 2.9 The Debye
relaxation contribution
D1 = − T Hz to the
static dielectric constant as a
function of temperature.
Lines are fit according to
(2.45)
Figure 2.9 shows the temperature dependencies of the Debye relaxation contributions D1 to the total static dielectric constant (0). Both curves obey the Curie–
Weiss law:
D1 (T ) = A/T + B,
(2.45)
where A equals 33,400 and 25,260 K
−1 , and B equals −40 and 0.20 for water and
ice, respectively. The curves intersect each other at the maximum supercooling temperature of water at atmospheric pressure, which is −48.3
◦ C (225 K) [26]. By coincidence, this temperature corresponds to the maximum of supercooling: below this
point water has never been observed in a liquid state at normal pressure.
Figure 2.10 shows the temperature dependencies of the static dielectric constant
at different pressures. Interestingly, in the supercritical region, where water is more
like a dense gas of H 2 O molecules [27], than a liquid, the dielectric constant of water
drops down to about 5, which is more than an order of magnitude lower than that
under normal conditions. This shows the important role of the cooperativity of water
molecules in the dielectric constant, and that the dipole moment of molecular does
not play a significant role.
The microscopic interpretation of the static dielectric constant of water has a
long history which is not yet complete. It is believed that water and ice have a high
2 The Interaction of Electromagnetic Waves with Water
Fig. 2.8 The temperature
dependencies of the
experimental static dielectric
constant, (0), of water [24]
and ice [25], measured by
the AC-bridge technique and
the three-terminal coaxial
capacitor method,
respectively. The right-hand
scale is for the density
function (solid lines)
Fig. 2.9 The Debye
relaxation contribution
D1 = − T Hz to the
static dielectric constant as a
function of temperature.
Lines are fit according to
(2.45)
Figure 2.9 shows the temperature dependencies of the Debye relaxation contributions D1 to the total static dielectric constant (0). Both curves obey the Curie–
Weiss law:
D1 (T ) = A/T + B,
(2.45)
where A equals 33,400 and 25,260 K
−1 , and B equals −40 and 0.20 for water and
ice, respectively. The curves intersect each other at the maximum supercooling temperature of water at atmospheric pressure, which is −48.3
◦ C (225 K) [26]. By coincidence, this temperature corresponds to the maximum of supercooling: below this
point water has never been observed in a liquid state at normal pressure.
Figure 2.10 shows the temperature dependencies of the static dielectric constant
at different pressures. Interestingly, in the supercritical region, where water is more
like a dense gas of H 2 O molecules [27], than a liquid, the dielectric constant of water
drops down to about 5, which is more than an order of magnitude lower than that
under normal conditions. This shows the important role of the cooperativity of water
molecules in the dielectric constant, and that the dipole moment of molecular does
not play a significant role.
The microscopic interpretation of the static dielectric constant of water has a
long history which is not yet complete. It is believed that water and ice have a high