

5.1 The Dielectric Response of Electrolyte Solutions
177
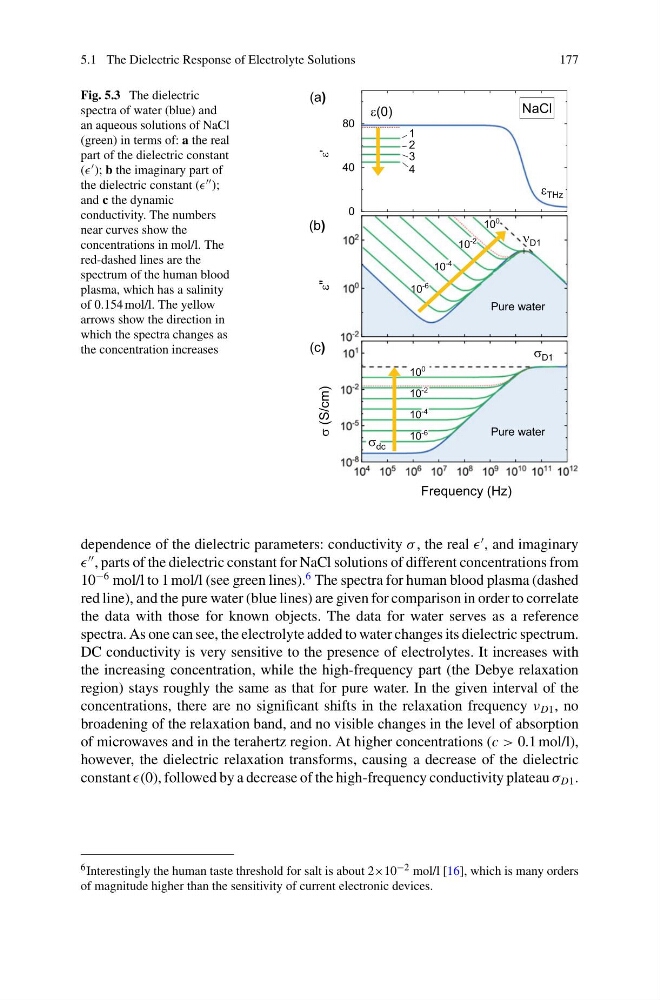
Fig. 5.3 The dielectric
spectra of water (blue) and
an aqueous solutions of NaCl
(green) in terms of: a the real
part of the dielectric constant
( ); b the imaginary part of
the dielectric constant ( );
and c the dynamic
conductivity. The numbers
near curves show the
concentrations in mol/l. The
red-dashed lines are the
spectrum of the human blood
plasma, which has a salinity
of 0.154 mol/l. The yellow
arrows show the direction in
which the spectra changes as
the concentration increases
dependence of the dielectric parameters: conductivity σ , the real
, and imaginary
, parts of the dielectric constant for NaCl solutions of different concentrations from
10
−6 mol/l to 1 mol/l (see green lines).
6 The spectra for human blood plasma (dashed
red line), and the pure water (blue lines) are given for comparison in order to correlate
the data with those for known objects. The data for water serves as a reference
spectra. As one can see, the electrolyte added to water changes its dielectric spectrum.
DC conductivity is very sensitive to the presence of electrolytes. It increases with
the increasing concentration, while the high-frequency part (the Debye relaxation
region) stays roughly the same as that for pure water. In the given interval of the
concentrations, there are no significant shifts in the relaxation frequency ν D1 , no
broadening of the relaxation band, and no visible changes in the level of absorption
of microwaves and in the terahertz region. At higher concentrations (c > 0.1 mol/l),
however, the dielectric relaxation transforms, causing a decrease of the dielectric
constant (0), followed by a decrease of the high-frequency conductivity plateau σ D1 .
6 Interestingly the human taste threshold for salt is about 2×10 −2 mol/l [16], which is many orders
of magnitude higher than the sensitivity of current electronic devices.
177
Fig. 5.3 The dielectric
spectra of water (blue) and
an aqueous solutions of NaCl
(green) in terms of: a the real
part of the dielectric constant
( ); b the imaginary part of
the dielectric constant ( );
and c the dynamic
conductivity. The numbers
near curves show the
concentrations in mol/l. The
red-dashed lines are the
spectrum of the human blood
plasma, which has a salinity
of 0.154 mol/l. The yellow
arrows show the direction in
which the spectra changes as
the concentration increases
dependence of the dielectric parameters: conductivity σ , the real
, and imaginary
, parts of the dielectric constant for NaCl solutions of different concentrations from
10
−6 mol/l to 1 mol/l (see green lines).
6 The spectra for human blood plasma (dashed
red line), and the pure water (blue lines) are given for comparison in order to correlate
the data with those for known objects. The data for water serves as a reference
spectra. As one can see, the electrolyte added to water changes its dielectric spectrum.
DC conductivity is very sensitive to the presence of electrolytes. It increases with
the increasing concentration, while the high-frequency part (the Debye relaxation
region) stays roughly the same as that for pure water. In the given interval of the
concentrations, there are no significant shifts in the relaxation frequency ν D1 , no
broadening of the relaxation band, and no visible changes in the level of absorption
of microwaves and in the terahertz region. At higher concentrations (c > 0.1 mol/l),
however, the dielectric relaxation transforms, causing a decrease of the dielectric
constant (0), followed by a decrease of the high-frequency conductivity plateau σ D1 .
6 Interestingly the human taste threshold for salt is about 2×10 −2 mol/l [16], which is many orders
of magnitude higher than the sensitivity of current electronic devices.