

150
4 The Dielectric Properties and Dynamic Structure of Water and Ice
+
+
+
+
-
-
-
-
-
+
+
+
+
-
-
-
-
-
+
+
+
+
-
-
-
-
-
(a)
(b)
(c)
(d)
+
+
+
+
-
-
-
-
-
+ + + + + + + +
-
-
-
-
-
+ + + + + + +
+ + + + + + + +
+ + + + + + +
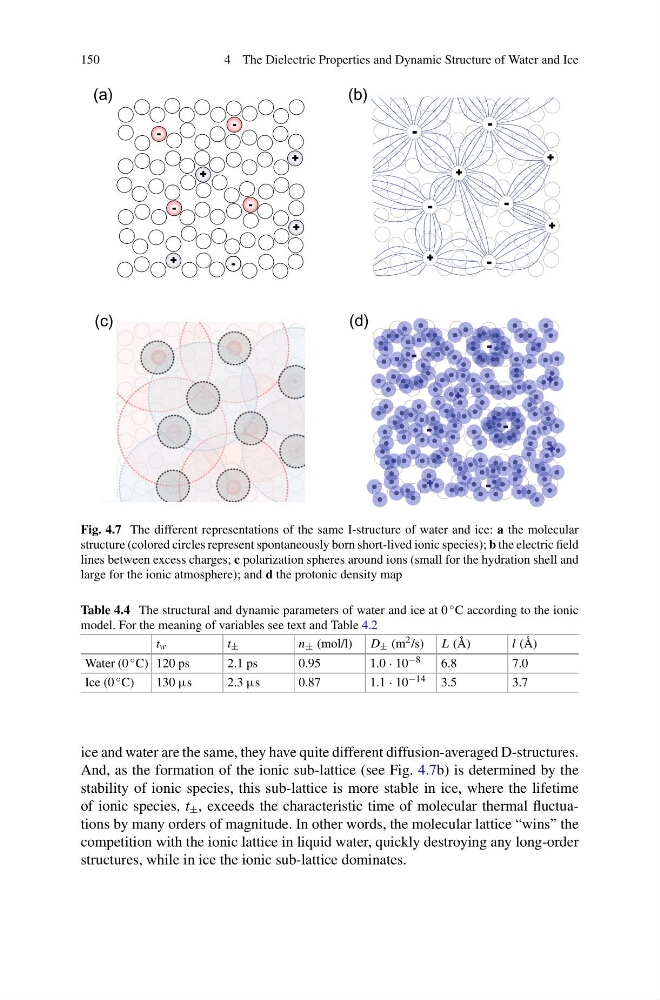
Fig. 4.7 The different representations of the same I-structure of water and ice: a the molecular
structure (colored circles represent spontaneously born short-lived ionic species); b the electric field
lines between excess charges; c polarization spheres around ions (small for the hydration shell and
large for the ionic atmosphere); and d the protonic density map
Table 4.4 The structural and dynamic parameters of water and ice at 0 ◦ C according to the ionic
model. For the meaning of variables see text and Table 4.2
t w
t ±
n ± (mol/l) D ± (m 2 /s) L (Å)
l (Å)
Water (0 ◦ C) 120 ps
2.1 ps
0.95
1.0 · 10 −8
6.8
7.0
Ice (0 ◦ C)
130 µs
2.3 µs
0.87
1.1 · 10 −14 3.5
3.7
ice and water are the same, they have quite different diffusion-averaged D-structures.
And, as the formation of the ionic sub-lattice (see Fig. 4.7b) is determined by the
stability of ionic species, this sub-lattice is more stable in ice, where the lifetime
of ionic species, t ± , exceeds the characteristic time of molecular thermal fluctuations by many orders of magnitude. In other words, the molecular lattice “wins” the
competition with the ionic lattice in liquid water, quickly destroying any long-order
structures, while in ice the ionic sub-lattice dominates.
4 The Dielectric Properties and Dynamic Structure of Water and Ice
+
+
+
+
-
-
-
-
-
+
+
+
+
-
-
-
-
-
+
+
+
+
-
-
-
-
-
(a)
(b)
(c)
(d)
+
+
+
+
-
-
-
-
-
+ + + + + + + +
-
-
-
-
-
+ + + + + + +
+ + + + + + + +
+ + + + + + +
Fig. 4.7 The different representations of the same I-structure of water and ice: a the molecular
structure (colored circles represent spontaneously born short-lived ionic species); b the electric field
lines between excess charges; c polarization spheres around ions (small for the hydration shell and
large for the ionic atmosphere); and d the protonic density map
Table 4.4 The structural and dynamic parameters of water and ice at 0 ◦ C according to the ionic
model. For the meaning of variables see text and Table 4.2
t w
t ±
n ± (mol/l) D ± (m 2 /s) L (Å)
l (Å)
Water (0 ◦ C) 120 ps
2.1 ps
0.95
1.0 · 10 −8
6.8
7.0
Ice (0 ◦ C)
130 µs
2.3 µs
0.87
1.1 · 10 −14 3.5
3.7
ice and water are the same, they have quite different diffusion-averaged D-structures.
And, as the formation of the ionic sub-lattice (see Fig. 4.7b) is determined by the
stability of ionic species, this sub-lattice is more stable in ice, where the lifetime
of ionic species, t ± , exceeds the characteristic time of molecular thermal fluctuations by many orders of magnitude. In other words, the molecular lattice “wins” the
competition with the ionic lattice in liquid water, quickly destroying any long-order
structures, while in ice the ionic sub-lattice dominates.