

4.4 Instantaneous Structure of Water and Ice
149
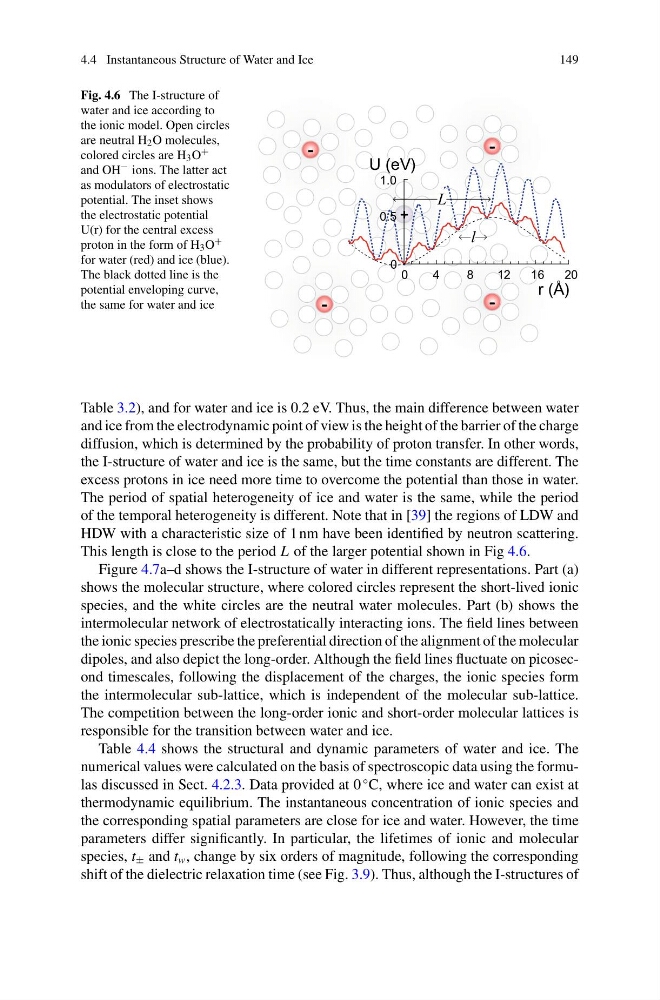
Fig. 4.6 The I-structure of
water and ice according to
the ionic model. Open circles
are neutral H 2 O molecules,
colored circles are H 3 O +
and OH − ions. The latter act
as modulators of electrostatic
potential. The inset shows
the electrostatic potential
U(r) for the central excess
proton in the form of H 3 O +
for water (red) and ice (blue).
The black dotted line is the
potential enveloping curve,
the same for water and ice
+
-
-
-
-
U (eV)
0
4
8
12
16
20
r (Å)
0
1.0
0.5
l
L
Table 3.2), and for water and ice is 0.2 eV. Thus, the main difference between water
and ice from the electrodynamic point of view is the height of the barrier of the charge
diffusion, which is determined by the probability of proton transfer. In other words,
the I-structure of water and ice is the same, but the time constants are different. The
excess protons in ice need more time to overcome the potential than those in water.
The period of spatial heterogeneity of ice and water is the same, while the period
of the temporal heterogeneity is different. Note that in [39] the regions of LDW and
HDW with a characteristic size of 1 nm have been identified by neutron scattering.
This length is close to the period L of the larger potential shown in Fig 4.6.
Figure 4.7a–d shows the I-structure of water in different representations. Part (a)
shows the molecular structure, where colored circles represent the short-lived ionic
species, and the white circles are the neutral water molecules. Part (b) shows the
intermolecular network of electrostatically interacting ions. The field lines between
the ionic species prescribe the preferential direction of the alignment of the molecular
dipoles, and also depict the long-order. Although the field lines fluctuate on picosecond timescales, following the displacement of the charges, the ionic species form
the intermolecular sub-lattice, which is independent of the molecular sub-lattice.
The competition between the long-order ionic and short-order molecular lattices is
responsible for the transition between water and ice.
Table 4.4 shows the structural and dynamic parameters of water and ice. The
numerical values were calculated on the basis of spectroscopic data using the formulas discussed in Sect. 4.2.3. Data provided at 0
◦ C, where ice and water can exist at
thermodynamic equilibrium. The instantaneous concentration of ionic species and
the corresponding spatial parameters are close for ice and water. However, the time
parameters differ significantly. In particular, the lifetimes of ionic and molecular
species, t ± and t w , change by six orders of magnitude, following the corresponding
shift of the dielectric relaxation time (see Fig. 3.9). Thus, although the I-structures of
149
Fig. 4.6 The I-structure of
water and ice according to
the ionic model. Open circles
are neutral H 2 O molecules,
colored circles are H 3 O +
and OH − ions. The latter act
as modulators of electrostatic
potential. The inset shows
the electrostatic potential
U(r) for the central excess
proton in the form of H 3 O +
for water (red) and ice (blue).
The black dotted line is the
potential enveloping curve,
the same for water and ice
+
-
-
-
-
U (eV)
0
4
8
12
16
20
r (Å)
0
1.0
0.5
l
L
Table 3.2), and for water and ice is 0.2 eV. Thus, the main difference between water
and ice from the electrodynamic point of view is the height of the barrier of the charge
diffusion, which is determined by the probability of proton transfer. In other words,
the I-structure of water and ice is the same, but the time constants are different. The
excess protons in ice need more time to overcome the potential than those in water.
The period of spatial heterogeneity of ice and water is the same, while the period
of the temporal heterogeneity is different. Note that in [39] the regions of LDW and
HDW with a characteristic size of 1 nm have been identified by neutron scattering.
This length is close to the period L of the larger potential shown in Fig 4.6.
Figure 4.7a–d shows the I-structure of water in different representations. Part (a)
shows the molecular structure, where colored circles represent the short-lived ionic
species, and the white circles are the neutral water molecules. Part (b) shows the
intermolecular network of electrostatically interacting ions. The field lines between
the ionic species prescribe the preferential direction of the alignment of the molecular
dipoles, and also depict the long-order. Although the field lines fluctuate on picosecond timescales, following the displacement of the charges, the ionic species form
the intermolecular sub-lattice, which is independent of the molecular sub-lattice.
The competition between the long-order ionic and short-order molecular lattices is
responsible for the transition between water and ice.
Table 4.4 shows the structural and dynamic parameters of water and ice. The
numerical values were calculated on the basis of spectroscopic data using the formulas discussed in Sect. 4.2.3. Data provided at 0
◦ C, where ice and water can exist at
thermodynamic equilibrium. The instantaneous concentration of ionic species and
the corresponding spatial parameters are close for ice and water. However, the time
parameters differ significantly. In particular, the lifetimes of ionic and molecular
species, t ± and t w , change by six orders of magnitude, following the corresponding
shift of the dielectric relaxation time (see Fig. 3.9). Thus, although the I-structures of