

4.2 A Phenomenological Model for the Broadband Dielectric Response
141
Table 4.2 The parameters of the dynamical structure of water according to the ionic model
Parameter
Formula
Value at 298 K
Physical meaning
t s (ps)
ν s //ν 2
s
1.6
Lifetime of ion in oscillatory state
t u (ps)
1/ν D2 – 1/ s
1.3
Lifetime of ion in translational
state (regime of naked ion)
t w (ps)
1/ν D1
49.5
Lifetime of H 2 O molecule
t ± (ps)
t s +t u
2.9
Lifetime of H 3 O + and OH − ions
n ± (mol/l)
n 0 · t ± /t w
1
Concentration of H 3 O + and OH −
ions (both short- and long-lived)
n pH (mol/l)
σ dc /(C · D 1 ) a
10 −7
Concentration of long-lived H 3 O +
and OH − ions only
D 2 (m 2 /s)
σ D2 /(C · n ± )
17 × 10 −9
Translational diffusion coefficient
of the naked ion
D 1 (m 2 /s)
σ D1 /(C · n ± )
14.2 × 10 −9
Effective diffusion coefficient of
the dressed ion
L (Å)
3
3 · 0.74/(4π n ± ) 8.4
Average distance between ions
(separation-reconstruction
diffusion length)
l (Å)
√
6D 1 t ±
3.4
Elementary diffusion step of
dressed ion
λ (Å)
√
6D 2 t u
2.9
Elementary diffusion step of naked
ion
a C = q 2 /k B T
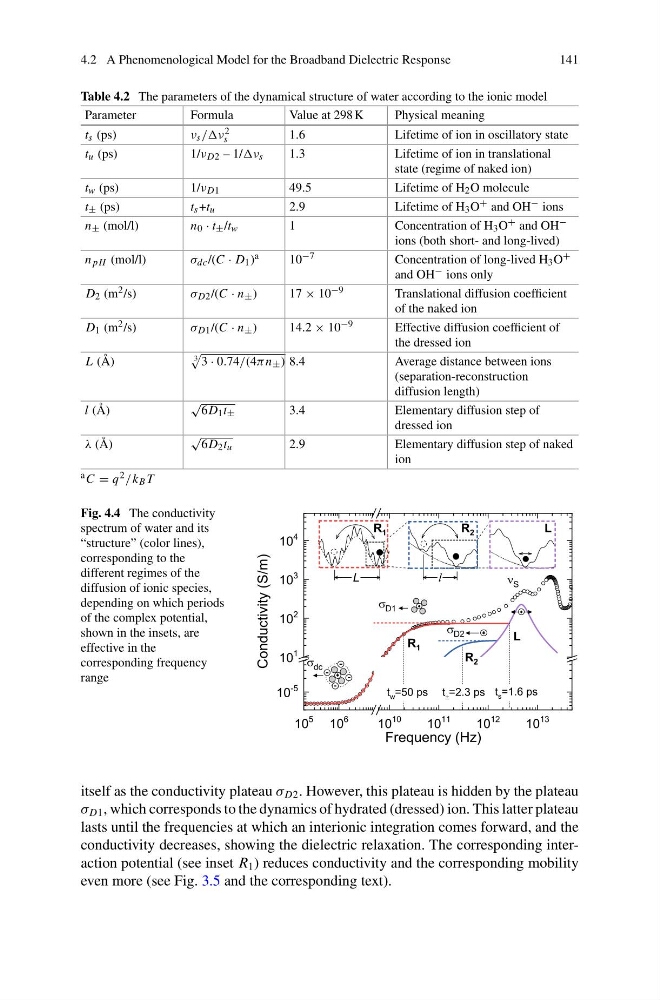
Fig. 4.4 The conductivity
spectrum of water and its
“structure” (color lines),
corresponding to the
different regimes of the
diffusion of ionic species,
depending on which periods
of the complex potential,
shown in the insets, are
effective in the
corresponding frequency
range
itself as the conductivity plateau σ D2 . However, this plateau is hidden by the plateau
σ D1 , which corresponds to the dynamics of hydrated (dressed) ion. This latter plateau
lasts until the frequencies at which an interionic integration comes forward, and the
conductivity decreases, showing the dielectric relaxation. The corresponding interaction potential (see inset R 1 ) reduces conductivity and the corresponding mobility
even more (see Fig. 3.5 and the corresponding text).
141
Table 4.2 The parameters of the dynamical structure of water according to the ionic model
Parameter
Formula
Value at 298 K
Physical meaning
t s (ps)
ν s //ν 2
s
1.6
Lifetime of ion in oscillatory state
t u (ps)
1/ν D2 – 1/ s
1.3
Lifetime of ion in translational
state (regime of naked ion)
t w (ps)
1/ν D1
49.5
Lifetime of H 2 O molecule
t ± (ps)
t s +t u
2.9
Lifetime of H 3 O + and OH − ions
n ± (mol/l)
n 0 · t ± /t w
1
Concentration of H 3 O + and OH −
ions (both short- and long-lived)
n pH (mol/l)
σ dc /(C · D 1 ) a
10 −7
Concentration of long-lived H 3 O +
and OH − ions only
D 2 (m 2 /s)
σ D2 /(C · n ± )
17 × 10 −9
Translational diffusion coefficient
of the naked ion
D 1 (m 2 /s)
σ D1 /(C · n ± )
14.2 × 10 −9
Effective diffusion coefficient of
the dressed ion
L (Å)
3
3 · 0.74/(4π n ± ) 8.4
Average distance between ions
(separation-reconstruction
diffusion length)
l (Å)
√
6D 1 t ±
3.4
Elementary diffusion step of
dressed ion
λ (Å)
√
6D 2 t u
2.9
Elementary diffusion step of naked
ion
a C = q 2 /k B T
Fig. 4.4 The conductivity
spectrum of water and its
“structure” (color lines),
corresponding to the
different regimes of the
diffusion of ionic species,
depending on which periods
of the complex potential,
shown in the insets, are
effective in the
corresponding frequency
range
itself as the conductivity plateau σ D2 . However, this plateau is hidden by the plateau
σ D1 , which corresponds to the dynamics of hydrated (dressed) ion. This latter plateau
lasts until the frequencies at which an interionic integration comes forward, and the
conductivity decreases, showing the dielectric relaxation. The corresponding interaction potential (see inset R 1 ) reduces conductivity and the corresponding mobility
even more (see Fig. 3.5 and the corresponding text).