

3.1 Dielectric-Terahertz Spectrum of Ice
107
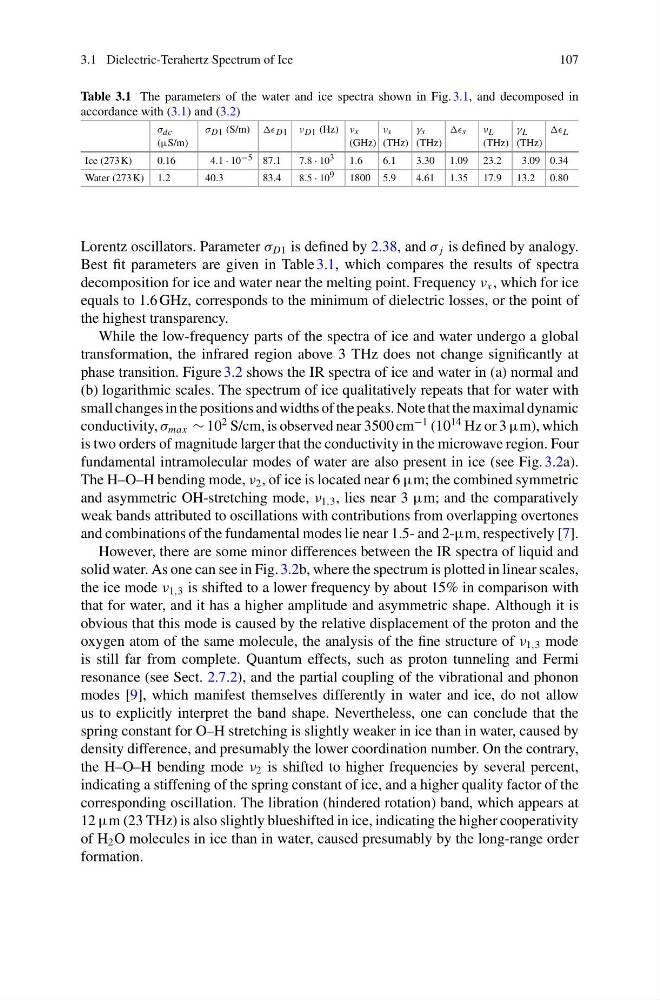
Table 3.1 The parameters of the water and ice spectra shown in Fig. 3.1, and decomposed in
accordance with (3.1) and (3.2)
σ dc
(µS/m)
σ D1 (S/m) D1 ν D1 (Hz) ν x
(GHz)
ν s
(THz)
γ s
(THz)
s
ν L
(THz)
γ L
(THz)
L
Ice (273 K)
0.16
4.1 · 10 −5 87.1
7.8 · 10 3
1.6
6.1
3.30 1.09 23.2
3.09 0.34
Water (273 K) 1.2
40.3
83.4
8.5 · 10 9
1800 5.9
4.61 1.35 17.9 13.2 0.80
Lorentz oscillators. Parameter σ D1 is defined by 2.38, and σ j is defined by analogy.
Best fit parameters are given in Table 3.1, which compares the results of spectra
decomposition for ice and water near the melting point. Frequency ν x , which for ice
equals to 1.6 GHz, corresponds to the minimum of dielectric losses, or the point of
the highest transparency.
While the low-frequency parts of the spectra of ice and water undergo a global
transformation, the infrared region above 3 THz does not change significantly at
phase transition. Figure 3.2 shows the IR spectra of ice and water in (a) normal and
(b) logarithmic scales. The spectrum of ice qualitatively repeats that for water with
small changes in the positions and widths of the peaks. Note that the maximal dynamic
conductivity, σ max ∼ 10
2 S/cm, is observed near 3500 cm
−1 (10
14 Hz or 3 µm), which
is two orders of magnitude larger that the conductivity in the microwave region. Four
fundamental intramolecular modes of water are also present in ice (see Fig. 3.2a).
The H–O–H bending mode, ν 2 , of ice is located near 6 µm; the combined symmetric
and asymmetric OH-stretching mode, ν 1,3 , lies near 3 µm; and the comparatively
weak bands attributed to oscillations with contributions from overlapping overtones
and combinations of the fundamental modes lie near 1.5- and 2-µm, respectively [7].
However, there are some minor differences between the IR spectra of liquid and
solid water. As one can see in Fig. 3.2b, where the spectrum is plotted in linear scales,
the ice mode ν 1,3 is shifted to a lower frequency by about 15% in comparison with
that for water, and it has a higher amplitude and asymmetric shape. Although it is
obvious that this mode is caused by the relative displacement of the proton and the
oxygen atom of the same molecule, the analysis of the fine structure of ν 1,3 mode
is still far from complete. Quantum effects, such as proton tunneling and Fermi
resonance (see Sect. 2.7.2), and the partial coupling of the vibrational and phonon
modes [9], which manifest themselves differently in water and ice, do not allow
us to explicitly interpret the band shape. Nevertheless, one can conclude that the
spring constant for O–H stretching is slightly weaker in ice than in water, caused by
density difference, and presumably the lower coordination number. On the contrary,
the H–O–H bending mode ν 2 is shifted to higher frequencies by several percent,
indicating a stiffening of the spring constant of ice, and a higher quality factor of the
corresponding oscillation. The libration (hindered rotation) band, which appears at
12 µm (23 THz) is also slightly blueshifted in ice, indicating the higher cooperativity
of H 2 O molecules in ice than in water, caused presumably by the long-range order
formation.
107
Table 3.1 The parameters of the water and ice spectra shown in Fig. 3.1, and decomposed in
accordance with (3.1) and (3.2)
σ dc
(µS/m)
σ D1 (S/m) D1 ν D1 (Hz) ν x
(GHz)
ν s
(THz)
γ s
(THz)
s
ν L
(THz)
γ L
(THz)
L
Ice (273 K)
0.16
4.1 · 10 −5 87.1
7.8 · 10 3
1.6
6.1
3.30 1.09 23.2
3.09 0.34
Water (273 K) 1.2
40.3
83.4
8.5 · 10 9
1800 5.9
4.61 1.35 17.9 13.2 0.80
Lorentz oscillators. Parameter σ D1 is defined by 2.38, and σ j is defined by analogy.
Best fit parameters are given in Table 3.1, which compares the results of spectra
decomposition for ice and water near the melting point. Frequency ν x , which for ice
equals to 1.6 GHz, corresponds to the minimum of dielectric losses, or the point of
the highest transparency.
While the low-frequency parts of the spectra of ice and water undergo a global
transformation, the infrared region above 3 THz does not change significantly at
phase transition. Figure 3.2 shows the IR spectra of ice and water in (a) normal and
(b) logarithmic scales. The spectrum of ice qualitatively repeats that for water with
small changes in the positions and widths of the peaks. Note that the maximal dynamic
conductivity, σ max ∼ 10
2 S/cm, is observed near 3500 cm
−1 (10
14 Hz or 3 µm), which
is two orders of magnitude larger that the conductivity in the microwave region. Four
fundamental intramolecular modes of water are also present in ice (see Fig. 3.2a).
The H–O–H bending mode, ν 2 , of ice is located near 6 µm; the combined symmetric
and asymmetric OH-stretching mode, ν 1,3 , lies near 3 µm; and the comparatively
weak bands attributed to oscillations with contributions from overlapping overtones
and combinations of the fundamental modes lie near 1.5- and 2-µm, respectively [7].
However, there are some minor differences between the IR spectra of liquid and
solid water. As one can see in Fig. 3.2b, where the spectrum is plotted in linear scales,
the ice mode ν 1,3 is shifted to a lower frequency by about 15% in comparison with
that for water, and it has a higher amplitude and asymmetric shape. Although it is
obvious that this mode is caused by the relative displacement of the proton and the
oxygen atom of the same molecule, the analysis of the fine structure of ν 1,3 mode
is still far from complete. Quantum effects, such as proton tunneling and Fermi
resonance (see Sect. 2.7.2), and the partial coupling of the vibrational and phonon
modes [9], which manifest themselves differently in water and ice, do not allow
us to explicitly interpret the band shape. Nevertheless, one can conclude that the
spring constant for O–H stretching is slightly weaker in ice than in water, caused by
density difference, and presumably the lower coordination number. On the contrary,
the H–O–H bending mode ν 2 is shifted to higher frequencies by several percent,
indicating a stiffening of the spring constant of ice, and a higher quality factor of the
corresponding oscillation. The libration (hindered rotation) band, which appears at
12 µm (23 THz) is also slightly blueshifted in ice, indicating the higher cooperativity
of H 2 O molecules in ice than in water, caused presumably by the long-range order
formation.