

86
2 The Interaction of Electromagnetic Waves with Water
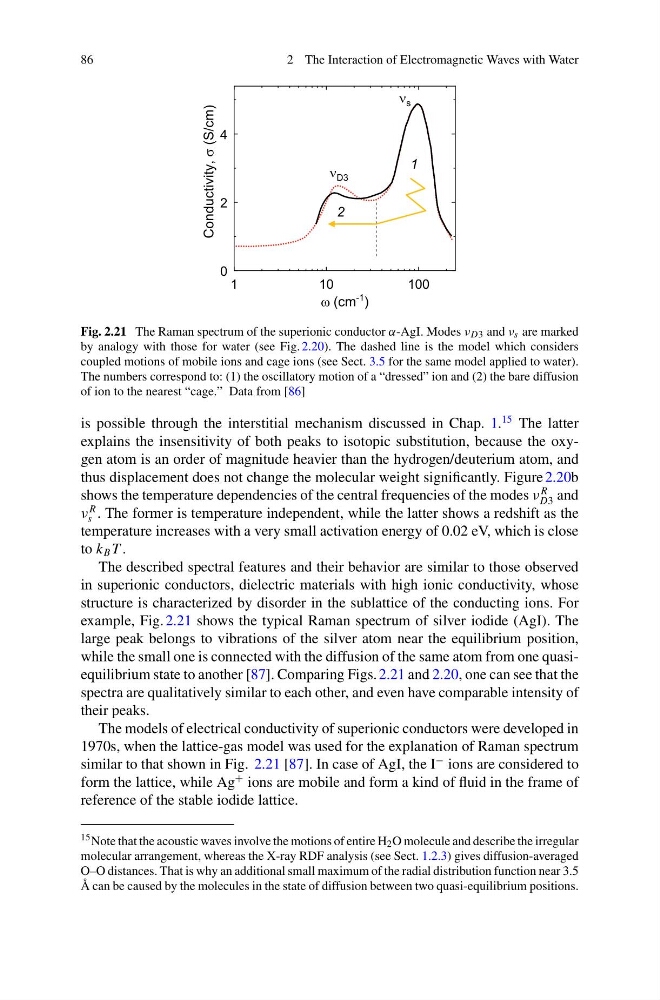
Fig. 2.21 The Raman spectrum of the superionic conductor α-AgI. Modes ν D3 and ν s are marked
by analogy with those for water (see Fig. 2.20). The dashed line is the model which considers
coupled motions of mobile ions and cage ions (see Sect. 3.5 for the same model applied to water).
The numbers correspond to: (1) the oscillatory motion of a “dressed” ion and (2) the bare diffusion
of ion to the nearest “cage.” Data from [86]
is possible through the interstitial mechanism discussed in Chap. 1.
15 The latter
explains the insensitivity of both peaks to isotopic substitution, because the oxygen atom is an order of magnitude heavier than the hydrogen/deuterium atom, and
thus displacement does not change the molecular weight significantly. Figure 2.20b
shows the temperature dependencies of the central frequencies of the modes ν
R
D3 and
ν
R
s . The former is temperature independent, while the latter shows a redshift as the
temperature increases with a very small activation energy of 0.02 eV, which is close
to k B T .
The described spectral features and their behavior are similar to those observed
in superionic conductors, dielectric materials with high ionic conductivity, whose
structure is characterized by disorder in the sublattice of the conducting ions. For
example, Fig. 2.21 shows the typical Raman spectrum of silver iodide (AgI). The
large peak belongs to vibrations of the silver atom near the equilibrium position,
while the small one is connected with the diffusion of the same atom from one quasiequilibrium state to another [87]. Comparing Figs. 2.21 and 2.20, one can see that the
spectra are qualitatively similar to each other, and even have comparable intensity of
their peaks.
The models of electrical conductivity of superionic conductors were developed in
1970s, when the lattice-gas model was used for the explanation of Raman spectrum
similar to that shown in Fig. 2.21 [87]. In case of AgI, the I
− ions are considered to
form the lattice, while Ag
+ ions are mobile and form a kind of fluid in the frame of
reference of the stable iodide lattice.
15 Note that the acoustic waves involve the motions of entire H 2 O molecule and describe the irregular
molecular arrangement, whereas the X-ray RDF analysis (see Sect. 1.2.3) gives diffusion-averaged
O–O distances. That is why an additional small maximum of the radial distribution function near 3.5
Å can be caused by the molecules in the state of diffusion between two quasi-equilibrium positions.
2 The Interaction of Electromagnetic Waves with Water
Fig. 2.21 The Raman spectrum of the superionic conductor α-AgI. Modes ν D3 and ν s are marked
by analogy with those for water (see Fig. 2.20). The dashed line is the model which considers
coupled motions of mobile ions and cage ions (see Sect. 3.5 for the same model applied to water).
The numbers correspond to: (1) the oscillatory motion of a “dressed” ion and (2) the bare diffusion
of ion to the nearest “cage.” Data from [86]
is possible through the interstitial mechanism discussed in Chap. 1.
15 The latter
explains the insensitivity of both peaks to isotopic substitution, because the oxygen atom is an order of magnitude heavier than the hydrogen/deuterium atom, and
thus displacement does not change the molecular weight significantly. Figure 2.20b
shows the temperature dependencies of the central frequencies of the modes ν
R
D3 and
ν
R
s . The former is temperature independent, while the latter shows a redshift as the
temperature increases with a very small activation energy of 0.02 eV, which is close
to k B T .
The described spectral features and their behavior are similar to those observed
in superionic conductors, dielectric materials with high ionic conductivity, whose
structure is characterized by disorder in the sublattice of the conducting ions. For
example, Fig. 2.21 shows the typical Raman spectrum of silver iodide (AgI). The
large peak belongs to vibrations of the silver atom near the equilibrium position,
while the small one is connected with the diffusion of the same atom from one quasiequilibrium state to another [87]. Comparing Figs. 2.21 and 2.20, one can see that the
spectra are qualitatively similar to each other, and even have comparable intensity of
their peaks.
The models of electrical conductivity of superionic conductors were developed in
1970s, when the lattice-gas model was used for the explanation of Raman spectrum
similar to that shown in Fig. 2.21 [87]. In case of AgI, the I
− ions are considered to
form the lattice, while Ag
+ ions are mobile and form a kind of fluid in the frame of
reference of the stable iodide lattice.
15 Note that the acoustic waves involve the motions of entire H 2 O molecule and describe the irregular
molecular arrangement, whereas the X-ray RDF analysis (see Sect. 1.2.3) gives diffusion-averaged
O–O distances. That is why an additional small maximum of the radial distribution function near 3.5
Å can be caused by the molecules in the state of diffusion between two quasi-equilibrium positions.