

71
Edge Detection and Segmentation of Images
(a)
(b)
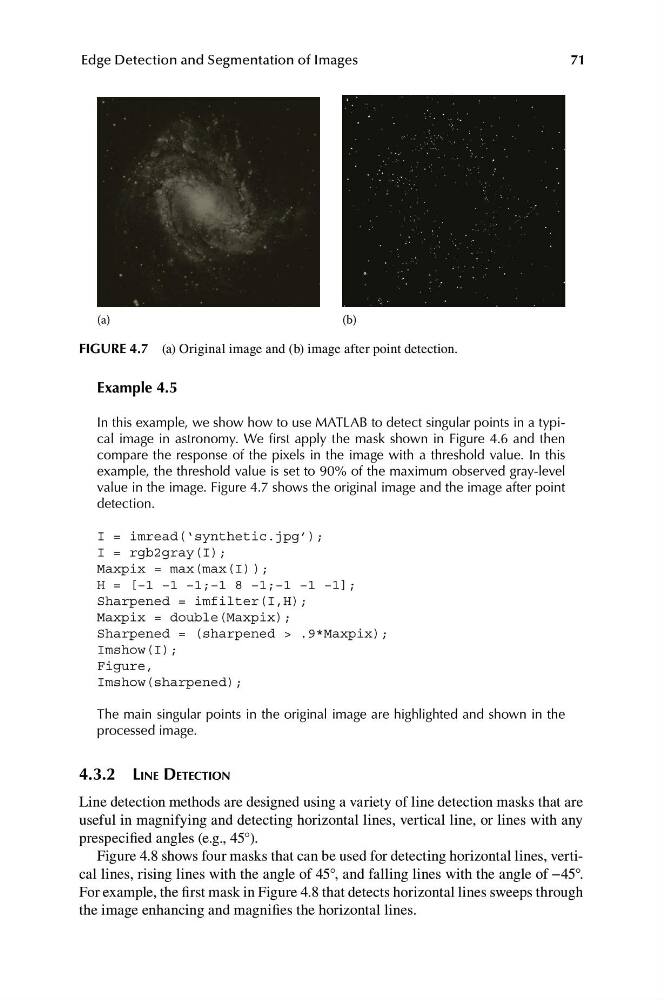
FIGURE 4.7 (a) Original image and (b) image after point detection.
Example 4.5
In this example, we show how to use MATLAB to detect singular points in a typical image in astronomy. We first apply the mask shown in Figure 4.6 and then
compare the response of the pixels in the image with a threshold value. In this
example, the threshold value is set to 90% of the maximum observed gray-level
value in the image. Figure 4.7 shows the original image and the image after point
detection.
I = imread(‘synthetic.jpg’);
I = rgb2gray(I);
Maxpix = max(max(I) );
H = [−1 −1 −1;−1 8 −1;−1 −1 −1];
Sharpened = imfilter(I,H);
Maxpix = double(Maxpix);
Sharpened = (sharpened > .9*Maxpix);
Imshow(I);
Figure,
Imshow(sharpened);
The main singular points in the original image are highlighted and shown in the
processed image.
4.3.2 LINE DETECTION
Line detection methods are designed using a variety of line detection masks that are
useful in magnifying and detecting horizontal lines, vertical line, or lines with any
prespecified angles (e.g., 45°).
Figure 4.8 shows four masks that can be used for detecting horizontal lines, vertical lines, rising lines with the angle of 45°, and falling lines with the angle of −45°.
For example, the first mask in Figure 4.8 that detects horizontal lines sweeps through
the image enhancing and magnifies the horizontal lines.
Edge Detection and Segmentation of Images
(a)
(b)
FIGURE 4.7 (a) Original image and (b) image after point detection.
Example 4.5
In this example, we show how to use MATLAB to detect singular points in a typical image in astronomy. We first apply the mask shown in Figure 4.6 and then
compare the response of the pixels in the image with a threshold value. In this
example, the threshold value is set to 90% of the maximum observed gray-level
value in the image. Figure 4.7 shows the original image and the image after point
detection.
I = imread(‘synthetic.jpg’);
I = rgb2gray(I);
Maxpix = max(max(I) );
H = [−1 −1 −1;−1 8 −1;−1 −1 −1];
Sharpened = imfilter(I,H);
Maxpix = double(Maxpix);
Sharpened = (sharpened > .9*Maxpix);
Imshow(I);
Figure,
Imshow(sharpened);
The main singular points in the original image are highlighted and shown in the
processed image.
4.3.2 LINE DETECTION
Line detection methods are designed using a variety of line detection masks that are
useful in magnifying and detecting horizontal lines, vertical line, or lines with any
prespecified angles (e.g., 45°).
Figure 4.8 shows four masks that can be used for detecting horizontal lines, vertical lines, rising lines with the angle of 45°, and falling lines with the angle of −45°.
For example, the first mask in Figure 4.8 that detects horizontal lines sweeps through
the image enhancing and magnifies the horizontal lines.