

315
Ultrasound Imaging
TABLE 16.1
Selected Acoustic Tissue Parameters
Speed of
Acoustic
Attenuation
Propagation
Propagation
Impedance Z A
Coefficient α at
Density
Velocity V
Tissue
V (m/s)
(kg/m 2 × 10 −6 )
1 MHz (dB/cm)
ρ (kg/m 3 )
(m/s)
Water
1540
1.48–1.53
0.002
1000
1480
Blood
1570
1.58–1.61
0.2
1030
1570
Fat
1460
1.37
0.6
900
1450
Muscle
1575
1.68
3.3
1080
1580
Bone
4000
6.0–8.0
12
1850
3500–4300
Acoustic attenuation is notoriously frequency dependent. In fact, the attenuation is almost linearly proportional to the frequency. More specifically, ultrasound
attenuation in biological tissues is almost proportional to the wave frequency over
the interval of 1–6 MHz, which is the typical range of interest in ultrasound imaging. In other words, the
a ratio is roughly constant for the typical range of medical
f
ultrasound imaging.
Knowing the frequency-dependent nature of attenuation in ultrasound waves, it
can be seen why the higher frequencies resulting from deep reflections will hardly
make it back to the piezoelectric sensor/detector. This in effect translates into a
low-pass filtering mechanism in acoustic imaging that becomes more visible as the
acoustic system needs to penetrate deeper to produce a meaningful image.
Usually one is interested in the ratio of a measured signal, P 1 , with respect to
the source signal, P 0 , and since practical signal ratios often cover a wide range, it is
convenient to express ratios in logarithmic form. The intensity ratio of the detected
signal, P 1 , measured with respect to the input signal, P 0 , in logarithmic format yields
the decibel expression as formulated in decibels (dB) as follows:
⎛ P 1 ⎞
dB = 10 log 10
(16.9)
⎝ ⎜ P 0 ⎠ ⎟
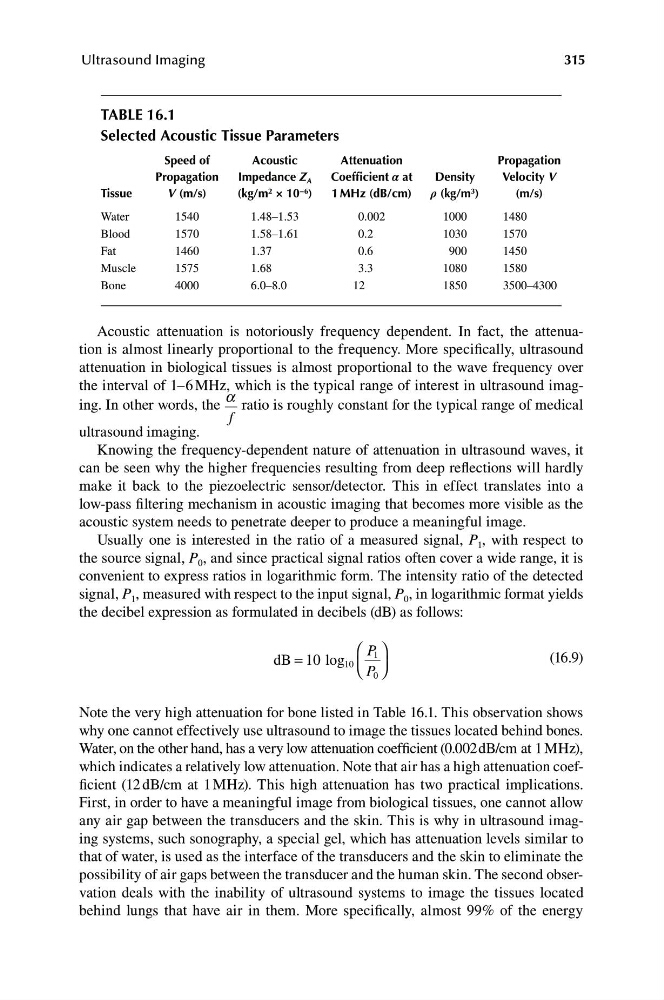
Note the very high attenuation for bone listed in Table 16.1. This observation shows
why one cannot effectively use ultrasound to image the tissues located behind bones.
Water, on the other hand, has a very low attenuation coefficient (0.002dB/cm at 1 MHz),
which indicates a relatively low attenuation. Note that air has a high attenuation coefficient (12 dB/cm at 1 MHz). This high attenuation has two practical implications.
First, in order to have a meaningful image from biological tissues, one cannot allow
any air gap between the transducers and the skin. This is why in ultrasound imaging systems, such sonography, a special gel, which has attenuation levels similar to
that of water, is used as the interface of the transducers and the skin to eliminate the
possibility of air gaps between the transducer and the human skin. The second observation deals with the inability of ultrasound systems to image the tissues located
behind lungs that have air in them. More specifically, almost 99% of the energy
Ultrasound Imaging
TABLE 16.1
Selected Acoustic Tissue Parameters
Speed of
Acoustic
Attenuation
Propagation
Propagation
Impedance Z A
Coefficient α at
Density
Velocity V
Tissue
V (m/s)
(kg/m 2 × 10 −6 )
1 MHz (dB/cm)
ρ (kg/m 3 )
(m/s)
Water
1540
1.48–1.53
0.002
1000
1480
Blood
1570
1.58–1.61
0.2
1030
1570
Fat
1460
1.37
0.6
900
1450
Muscle
1575
1.68
3.3
1080
1580
Bone
4000
6.0–8.0
12
1850
3500–4300
Acoustic attenuation is notoriously frequency dependent. In fact, the attenuation is almost linearly proportional to the frequency. More specifically, ultrasound
attenuation in biological tissues is almost proportional to the wave frequency over
the interval of 1–6 MHz, which is the typical range of interest in ultrasound imaging. In other words, the
a ratio is roughly constant for the typical range of medical
f
ultrasound imaging.
Knowing the frequency-dependent nature of attenuation in ultrasound waves, it
can be seen why the higher frequencies resulting from deep reflections will hardly
make it back to the piezoelectric sensor/detector. This in effect translates into a
low-pass filtering mechanism in acoustic imaging that becomes more visible as the
acoustic system needs to penetrate deeper to produce a meaningful image.
Usually one is interested in the ratio of a measured signal, P 1 , with respect to
the source signal, P 0 , and since practical signal ratios often cover a wide range, it is
convenient to express ratios in logarithmic form. The intensity ratio of the detected
signal, P 1 , measured with respect to the input signal, P 0 , in logarithmic format yields
the decibel expression as formulated in decibels (dB) as follows:
⎛ P 1 ⎞
dB = 10 log 10
(16.9)
⎝ ⎜ P 0 ⎠ ⎟
Note the very high attenuation for bone listed in Table 16.1. This observation shows
why one cannot effectively use ultrasound to image the tissues located behind bones.
Water, on the other hand, has a very low attenuation coefficient (0.002dB/cm at 1 MHz),
which indicates a relatively low attenuation. Note that air has a high attenuation coefficient (12 dB/cm at 1 MHz). This high attenuation has two practical implications.
First, in order to have a meaningful image from biological tissues, one cannot allow
any air gap between the transducers and the skin. This is why in ultrasound imaging systems, such sonography, a special gel, which has attenuation levels similar to
that of water, is used as the interface of the transducers and the skin to eliminate the
possibility of air gaps between the transducer and the human skin. The second observation deals with the inability of ultrasound systems to image the tissues located
behind lungs that have air in them. More specifically, almost 99% of the energy