

a. U se edge detection methods (in particular, region growing technique) and
display the discontinuity of the broken bone.
b. C hoose some seed values in the middle of each region to start the region
growing process.
c. Find the maximum length of the gap.
14.3 O steoporosis is often indicated by loss of bone density. Several methods are
available to measure bone density, but, currently, the most widely used technique is DEXA (dual energy x-ray absorptiometry). The bone mass density
(BMD) is often the accepted indication of osteoporosis (Table 14.1). Read
image file “p_14_3.jpg.” Image “p_14_3.jpg” is an image of the lumbar spine
of a patient with severe osteoporosis with multiple fractures.* The BMD is
approximately 10 mg/cm 3 , with a T-score of −6.
a. The file contains two images attached to each other. Use MATLAB ® to
separate the two images and display the images separately.
b. Design a thresholding method to determine the most obvious locations of
osteoporosis outlined by the red ellipse. Osteoporosis is determined based
on the increased x-ray transmission and the scale of apparent bone thickness illustrated in the insert (darker image tone due to increased oxidation
of the photographic plate). Hint: You can start with creating the histogram
and identifying the range of gray levels corresponding to oxidation.
c. T he angle between vertebrae is an important indicator for spine problems.
Use edge detection to find the outline of the vertebrae. Determine the
angle between the three lower vertebrae of the lumbar spine in the image.
d. Fractures in the bone resulting from osteoporosis are also visible. Use
thresholding techniques to locate the fracture sites.
14.4 Read image file “p_14_4.jpg” and display the image. Image “p_14_4.jpg” shows
the axial, sagittal, and coronal views of the lumbar spine region (L1 and L2) of a
patient with relatively normal bone mass density.* However, the trabecular bone
is inhomogeneous and there is significant mineralization between L1 and L2
(indicated by the blue arrows). Other abnormalities in the bone structure are the
280
Biomedical Signal and Image Processing
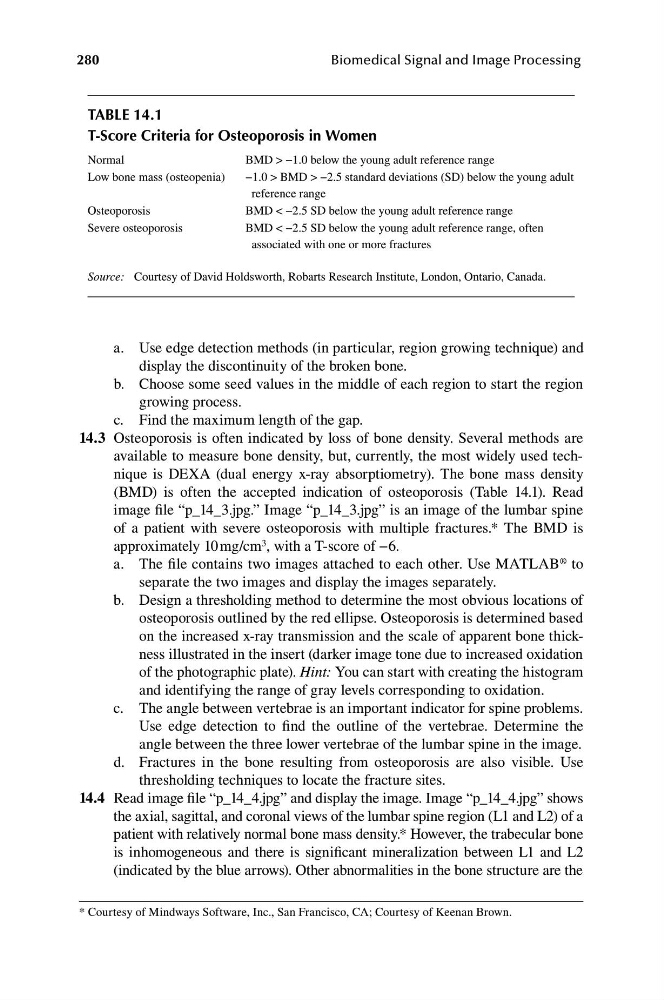
TABLE 14.1
T-Score Criteria for Osteoporosis in Women
Normal
BMD > −1.0 below the young adult reference range
Low bone mass (osteopenia)
−1.0 > BMD > −2.5 standard deviations (SD) below the young adult
reference range
Osteoporosis
BMD < −2.5 SD below the young adult reference range
Severe osteoporosis
BMD < −2.5 SD below the young adult reference range, often
associated with one or more fractures
Source: Courtesy of David Holdsworth, Robarts Research Institute, London, Ontario, Canada.
* Courtesy of Mindways Software, Inc., San Francisco, CA; Courtesy of Keenan Brown.
display the discontinuity of the broken bone.
b. C hoose some seed values in the middle of each region to start the region
growing process.
c. Find the maximum length of the gap.
14.3 O steoporosis is often indicated by loss of bone density. Several methods are
available to measure bone density, but, currently, the most widely used technique is DEXA (dual energy x-ray absorptiometry). The bone mass density
(BMD) is often the accepted indication of osteoporosis (Table 14.1). Read
image file “p_14_3.jpg.” Image “p_14_3.jpg” is an image of the lumbar spine
of a patient with severe osteoporosis with multiple fractures.* The BMD is
approximately 10 mg/cm 3 , with a T-score of −6.
a. The file contains two images attached to each other. Use MATLAB ® to
separate the two images and display the images separately.
b. Design a thresholding method to determine the most obvious locations of
osteoporosis outlined by the red ellipse. Osteoporosis is determined based
on the increased x-ray transmission and the scale of apparent bone thickness illustrated in the insert (darker image tone due to increased oxidation
of the photographic plate). Hint: You can start with creating the histogram
and identifying the range of gray levels corresponding to oxidation.
c. T he angle between vertebrae is an important indicator for spine problems.
Use edge detection to find the outline of the vertebrae. Determine the
angle between the three lower vertebrae of the lumbar spine in the image.
d. Fractures in the bone resulting from osteoporosis are also visible. Use
thresholding techniques to locate the fracture sites.
14.4 Read image file “p_14_4.jpg” and display the image. Image “p_14_4.jpg” shows
the axial, sagittal, and coronal views of the lumbar spine region (L1 and L2) of a
patient with relatively normal bone mass density.* However, the trabecular bone
is inhomogeneous and there is significant mineralization between L1 and L2
(indicated by the blue arrows). Other abnormalities in the bone structure are the
280
Biomedical Signal and Image Processing
TABLE 14.1
T-Score Criteria for Osteoporosis in Women
Normal
BMD > −1.0 below the young adult reference range
Low bone mass (osteopenia)
−1.0 > BMD > −2.5 standard deviations (SD) below the young adult
reference range
Osteoporosis
BMD < −2.5 SD below the young adult reference range
Severe osteoporosis
BMD < −2.5 SD below the young adult reference range, often
associated with one or more fractures
Source: Courtesy of David Holdsworth, Robarts Research Institute, London, Ontario, Canada.
* Courtesy of Mindways Software, Inc., San Francisco, CA; Courtesy of Keenan Brown.