

0.7
0.6
0.5
0.4
0.3
0.2
0.1
0
0
2 0
4 0
6 0
Sample number (in frequency)
Power spectrum
80
100
120
140
232
Biomedical Signal and Image Processing
this signal. Representing the EMG signal as x, another important feature called the
AVR value measure is defined as
∑
N −1
x i
( )
AVR =
i=0
(11.2)
N
AVR describes the average of absolute variations in the signal and is often used to
express the smoothness, or respectively the nonsmoothness, of the signal.
11.6.3 FREQUENCY- AND WAVELET-DOMAIN ANALYSIS
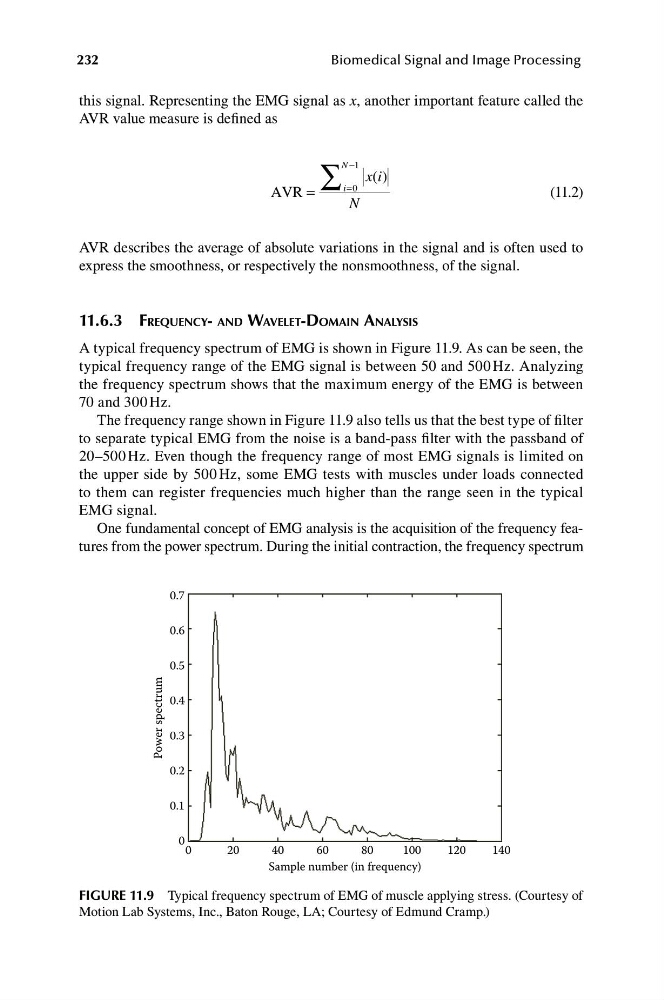
A typical frequency spectrum of EMG is shown in Figure 11.9. As can be seen, the
typical frequency range of the EMG signal is between 50 and 500 Hz. Analyzing
the frequency spectrum shows that the maximum energy of the EMG is between
70 and 300 Hz.
The frequency range shown in Figure 11.9 also tells us that the best type of filter
to separate typical EMG from the noise is a band-pass filter with the passband of
20–500 Hz. Even though the frequency range of most EMG signals is limited on
the upper side by 500 Hz, some EMG tests with muscles under loads connected
to them can register frequencies much higher than the range seen in the typical
EMG signal.
One fundamental concept of EMG analysis is the acquisition of the frequency features from the power spectrum. During the initial contraction, the frequency spectrum
FIGURE 11.9 Typical frequency spectrum of EMG of muscle applying stress. (Courtesy of
Motion Lab Systems, Inc., Baton Rouge, LA; Courtesy of Edmund Cramp.)
0.6
0.5
0.4
0.3
0.2
0.1
0
0
2 0
4 0
6 0
Sample number (in frequency)
Power spectrum
80
100
120
140
232
Biomedical Signal and Image Processing
this signal. Representing the EMG signal as x, another important feature called the
AVR value measure is defined as
∑
N −1
x i
( )
AVR =
i=0
(11.2)
N
AVR describes the average of absolute variations in the signal and is often used to
express the smoothness, or respectively the nonsmoothness, of the signal.
11.6.3 FREQUENCY- AND WAVELET-DOMAIN ANALYSIS
A typical frequency spectrum of EMG is shown in Figure 11.9. As can be seen, the
typical frequency range of the EMG signal is between 50 and 500 Hz. Analyzing
the frequency spectrum shows that the maximum energy of the EMG is between
70 and 300 Hz.
The frequency range shown in Figure 11.9 also tells us that the best type of filter
to separate typical EMG from the noise is a band-pass filter with the passband of
20–500 Hz. Even though the frequency range of most EMG signals is limited on
the upper side by 500 Hz, some EMG tests with muscles under loads connected
to them can register frequencies much higher than the range seen in the typical
EMG signal.
One fundamental concept of EMG analysis is the acquisition of the frequency features from the power spectrum. During the initial contraction, the frequency spectrum
FIGURE 11.9 Typical frequency spectrum of EMG of muscle applying stress. (Courtesy of
Motion Lab Systems, Inc., Baton Rouge, LA; Courtesy of Edmund Cramp.)