

231
Electromyogram
distant muscle groups. Other sources of noise on the surface EMG are ECG and
breathing signals. These noise sources can be rather successfully filtered using
band-pass filters centered around the main frequency spectrum of the EMG signal.
A major source of noise in EMG is the motion artifact. This noise is caused by
unwanted motion of electrodes, wires, and muscles. However, since the frequency
range of the motion artifact is between 0 and 20 Hz, this source of noise can be easily filtered using a low-pass filter, as discussed next. Before explaining the filtering
methods, however, it is insightful to note a significant difference between EMG and
other signals that affects the acquisition and therefore the noise susceptibility of
EMG. A major difference between EMG and other biomedical signals such as the
EEG and ECG is the fact that EMG does not use a single reference electrode while
the other two do. The single reference electrode is not a feasible option since each
muscle that is investigated can be in any part of the body of the subject under investigation. For the heart and the brain, this is not a serious concern since the ECG and
EEG are recorded in the same anatomical location every single time. The differential
nature of EMG acquisition helps reducing the noise during the acquisition step and
therefore simplifying the filtering step in the signal processing level, discussed next.
11.6.2 TIME-DOMAIN ANALYSIS
For the signal processing, as with other signals mentioned in the previous chapters,
there is a standard set of features that can be used to investigate and compare the
clinical significance of the image. The features of interest in 1-D muscle signal
image processing are the power distribution of signal in specified frequency ranges,
wavelet coefficients at different scales, complexity, and mobility, and additionally
fractal dimensions are always informative features for any kind of biomedical signal.
However, some specific features are more frequently used for the analysis of EMG
signals than for other signals. These tools are RMS analysis and average rectified
(AVR), as introduced next.
Since EMG is the signal for several muscle cells combined, averaging can reveal
commonalities that will get lost in the collective signals. The energy of the EMG
signal, as a common denominator, can provide the clinical relevance of the muscle
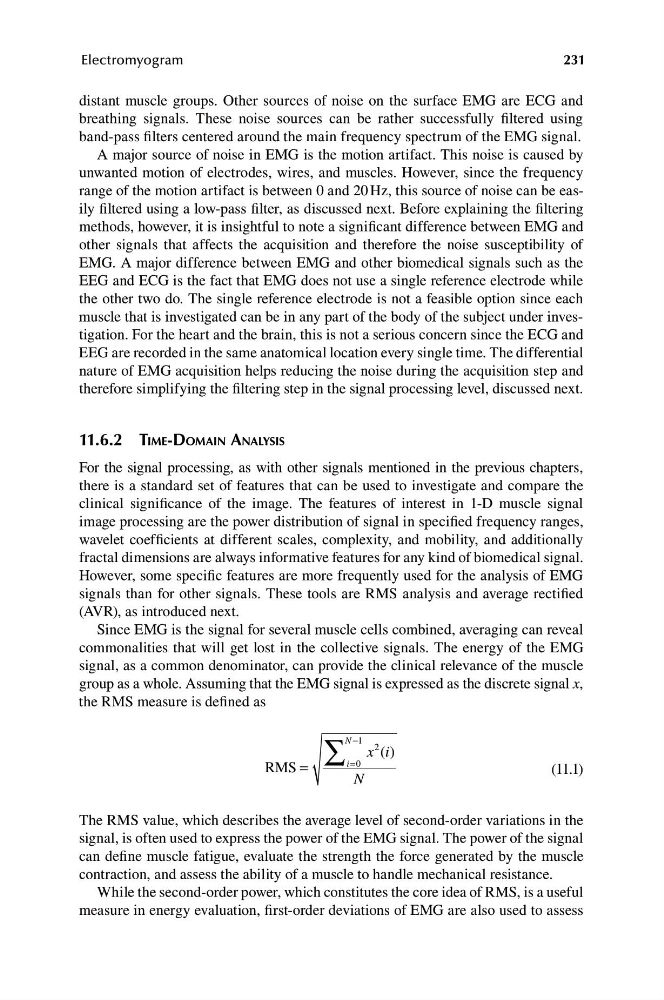
group as a whole. Assuming that the EMG signal is expressed as the discrete signal x,
the RMS measure is defined as
∑
N −1
x i
2 ( )
RMS =
i=0
(11.1)
N
The RMS value, which describes the average level of second-order variations in the
signal, is often used to express the power of the EMG signal. The power of the signal
can define muscle fatigue, evaluate the strength the force generated by the muscle
contraction, and assess the ability of a muscle to handle mechanical resistance.
While the second-order power, which constitutes the core idea of RMS, is a useful
measure in energy evaluation, first-order deviations of EMG are also used to assess
Electromyogram
distant muscle groups. Other sources of noise on the surface EMG are ECG and
breathing signals. These noise sources can be rather successfully filtered using
band-pass filters centered around the main frequency spectrum of the EMG signal.
A major source of noise in EMG is the motion artifact. This noise is caused by
unwanted motion of electrodes, wires, and muscles. However, since the frequency
range of the motion artifact is between 0 and 20 Hz, this source of noise can be easily filtered using a low-pass filter, as discussed next. Before explaining the filtering
methods, however, it is insightful to note a significant difference between EMG and
other signals that affects the acquisition and therefore the noise susceptibility of
EMG. A major difference between EMG and other biomedical signals such as the
EEG and ECG is the fact that EMG does not use a single reference electrode while
the other two do. The single reference electrode is not a feasible option since each
muscle that is investigated can be in any part of the body of the subject under investigation. For the heart and the brain, this is not a serious concern since the ECG and
EEG are recorded in the same anatomical location every single time. The differential
nature of EMG acquisition helps reducing the noise during the acquisition step and
therefore simplifying the filtering step in the signal processing level, discussed next.
11.6.2 TIME-DOMAIN ANALYSIS
For the signal processing, as with other signals mentioned in the previous chapters,
there is a standard set of features that can be used to investigate and compare the
clinical significance of the image. The features of interest in 1-D muscle signal
image processing are the power distribution of signal in specified frequency ranges,
wavelet coefficients at different scales, complexity, and mobility, and additionally
fractal dimensions are always informative features for any kind of biomedical signal.
However, some specific features are more frequently used for the analysis of EMG
signals than for other signals. These tools are RMS analysis and average rectified
(AVR), as introduced next.
Since EMG is the signal for several muscle cells combined, averaging can reveal
commonalities that will get lost in the collective signals. The energy of the EMG
signal, as a common denominator, can provide the clinical relevance of the muscle
group as a whole. Assuming that the EMG signal is expressed as the discrete signal x,
the RMS measure is defined as
∑
N −1
x i
2 ( )
RMS =
i=0
(11.1)
N
The RMS value, which describes the average level of second-order variations in the
signal, is often used to express the power of the EMG signal. The power of the signal
can define muscle fatigue, evaluate the strength the force generated by the muscle
contraction, and assess the ability of a muscle to handle mechanical resistance.
While the second-order power, which constitutes the core idea of RMS, is a useful
measure in energy evaluation, first-order deviations of EMG are also used to assess