

200
Biomedical Signal and Image Processing
P g1
P g1
F P1
A 1
T 7
T 3
T 5
P 3
C 3
F 3
P z
F P1 F P2
F 7
F 8
T 3 C 3
T 5
T 6
P 3
P 4
P 3
P 4
C 4 T 4
P z
C z
P z
O 1
O 2
C z
F z
A 2
O 1
A 1
Right
ear
Left
ear
(a)
(b)
Ear
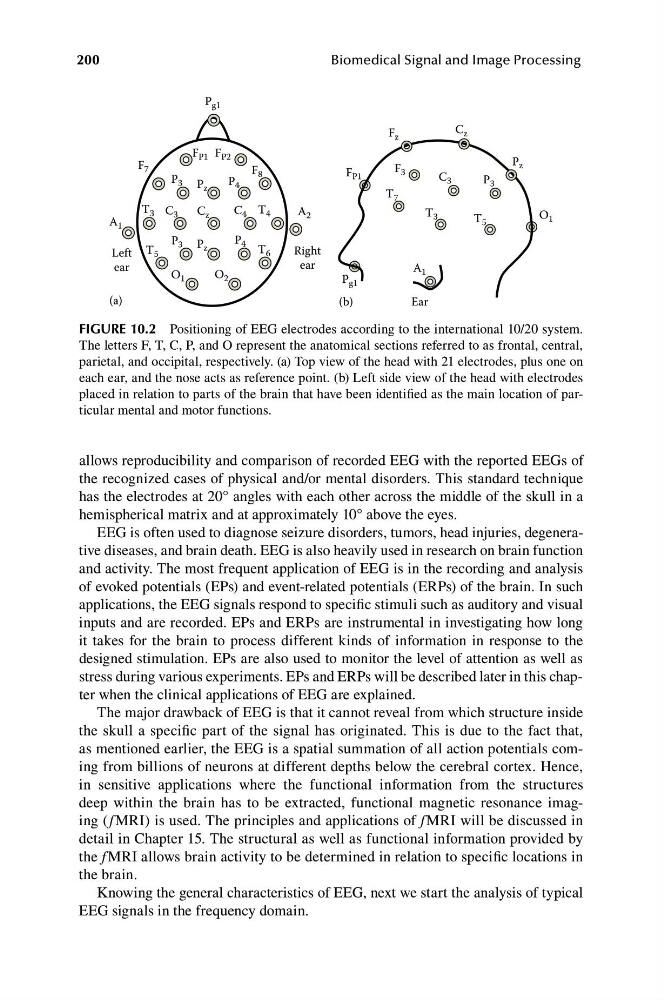
FIGURE 10.2 Positioning of EEG electrodes according to the international 10/20 system.
The letters F, T, C, P, and O represent the anatomical sections referred to as frontal, central,
parietal, and occipital, respectively. (a) Top view of the head with 21 electrodes, plus one on
each ear, and the nose acts as reference point. (b) Left side view of the head with electrodes
placed in relation to parts of the brain that have been identified as the main location of particular mental and motor functions.
allows reproducibility and comparison of recorded EEG with the reported EEGs of
the recognized cases of physical and/or mental disorders. This standard technique
has the electrodes at 20° angles with each other across the middle of the skull in a
hemispherical matrix and at approximately 10° above the eyes.
EEG is often used to diagnose seizure disorders, tumors, head injuries, degenerative diseases, and brain death. EEG is also heavily used in research on brain function
and activity. The most frequent application of EEG is in the recording and analysis
of evoked potentials (EPs) and event-related potentials (ERPs) of the brain. In such
applications, the EEG signals respond to specific stimuli such as auditory and visual
inputs and are recorded. EPs and ERPs are instrumental in investigating how long
it takes for the brain to process different kinds of information in response to the
designed stimulation. EPs are also used to monitor the level of attention as well as
stress during various experiments. EPs and ERPs will be described later in this chapter when the clinical applications of EEG are explained.
The major drawback of EEG is that it cannot reveal from which structure inside
the skull a specific part of the signal has originated. This is due to the fact that,
as mentioned earlier, the EEG is a spatial summation of all action potentials coming from billions of neurons at different depths below the cerebral cortex. Hence,
in sensitive applications where the functional information from the structures
deep within the brain has to be extracted, functional magnetic resonance imaging (f MRI) is used. The principles and applications of f MRI will be discussed in
detail in Chapter 15. The structural as well as functional information provided by
the f MRI allows brain activity to be determined in relation to specific locations in
the brain.
Knowing the general characteristics of EEG, next we start the analysis of typical
EEG signals in the frequency domain.
Biomedical Signal and Image Processing
P g1
P g1
F P1
A 1
T 7
T 3
T 5
P 3
C 3
F 3
P z
F P1 F P2
F 7
F 8
T 3 C 3
T 5
T 6
P 3
P 4
P 3
P 4
C 4 T 4
P z
C z
P z
O 1
O 2
C z
F z
A 2
O 1
A 1
Right
ear
Left
ear
(a)
(b)
Ear
FIGURE 10.2 Positioning of EEG electrodes according to the international 10/20 system.
The letters F, T, C, P, and O represent the anatomical sections referred to as frontal, central,
parietal, and occipital, respectively. (a) Top view of the head with 21 electrodes, plus one on
each ear, and the nose acts as reference point. (b) Left side view of the head with electrodes
placed in relation to parts of the brain that have been identified as the main location of particular mental and motor functions.
allows reproducibility and comparison of recorded EEG with the reported EEGs of
the recognized cases of physical and/or mental disorders. This standard technique
has the electrodes at 20° angles with each other across the middle of the skull in a
hemispherical matrix and at approximately 10° above the eyes.
EEG is often used to diagnose seizure disorders, tumors, head injuries, degenerative diseases, and brain death. EEG is also heavily used in research on brain function
and activity. The most frequent application of EEG is in the recording and analysis
of evoked potentials (EPs) and event-related potentials (ERPs) of the brain. In such
applications, the EEG signals respond to specific stimuli such as auditory and visual
inputs and are recorded. EPs and ERPs are instrumental in investigating how long
it takes for the brain to process different kinds of information in response to the
designed stimulation. EPs are also used to monitor the level of attention as well as
stress during various experiments. EPs and ERPs will be described later in this chapter when the clinical applications of EEG are explained.
The major drawback of EEG is that it cannot reveal from which structure inside
the skull a specific part of the signal has originated. This is due to the fact that,
as mentioned earlier, the EEG is a spatial summation of all action potentials coming from billions of neurons at different depths below the cerebral cortex. Hence,
in sensitive applications where the functional information from the structures
deep within the brain has to be extracted, functional magnetic resonance imaging (f MRI) is used. The principles and applications of f MRI will be discussed in
detail in Chapter 15. The structural as well as functional information provided by
the f MRI allows brain activity to be determined in relation to specific locations in
the brain.
Knowing the general characteristics of EEG, next we start the analysis of typical
EEG signals in the frequency domain.