

185
Electrocardiogram
I
aV R
V1
V4
II
aV L
V2
V5
III
aV F
V3
V6
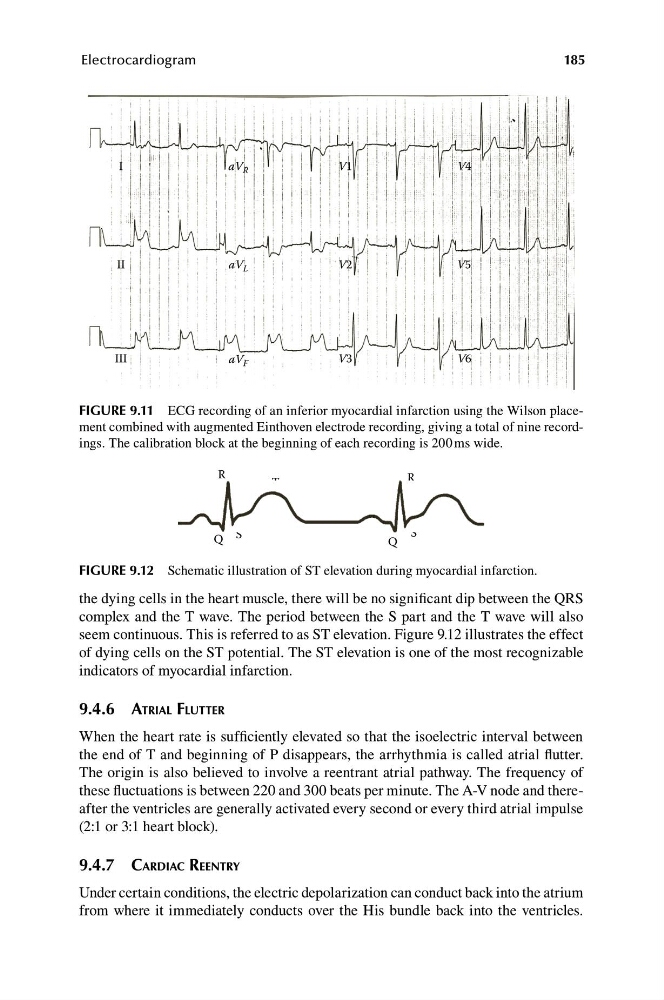
FIGURE 9.11 ECG recording of an inferior myocardial infarction using the Wilson placement combined with augmented Einthoven electrode recording, giving a total of nine recordings. The calibration block at the beginning of each recording is 200 ms wide.
R
R
T
T
P
P
S
S
Q
Q
FIGURE 9.12 Schematic illustration of ST elevation during myocardial infarction.
the dying cells in the heart muscle, there will be no significant dip between the QRS
complex and the T wave. The period between the S part and the T wave will also
seem continuous. This is referred to as ST elevation. Figure 9.12 illustrates the effect
of dying cells on the ST potential. The ST elevation is one of the most recognizable
indicators of myocardial infarction.
9.4.6 ATRIAL FLUTTER
When the heart rate is sufficiently elevated so that the isoelectric interval between
the end of T and beginning of P disappears, the arrhythmia is called atrial flutter.
The origin is also believed to involve a reentrant atrial pathway. The frequency of
these fluctuations is between 220 and 300 beats per minute. The A-V node and thereafter the ventricles are generally activated every second or every third atrial impulse
(2:1 or 3:1 heart block).
9.4.7 CARDIAC REENTRY
Under certain conditions, the electric depolarization can conduct back into the atrium
from where it immediately conducts over the His bundle back into the ventricles.
Electrocardiogram
I
aV R
V1
V4
II
aV L
V2
V5
III
aV F
V3
V6
FIGURE 9.11 ECG recording of an inferior myocardial infarction using the Wilson placement combined with augmented Einthoven electrode recording, giving a total of nine recordings. The calibration block at the beginning of each recording is 200 ms wide.
R
R
T
T
P
P
S
S
Q
Q
FIGURE 9.12 Schematic illustration of ST elevation during myocardial infarction.
the dying cells in the heart muscle, there will be no significant dip between the QRS
complex and the T wave. The period between the S part and the T wave will also
seem continuous. This is referred to as ST elevation. Figure 9.12 illustrates the effect
of dying cells on the ST potential. The ST elevation is one of the most recognizable
indicators of myocardial infarction.
9.4.6 ATRIAL FLUTTER
When the heart rate is sufficiently elevated so that the isoelectric interval between
the end of T and beginning of P disappears, the arrhythmia is called atrial flutter.
The origin is also believed to involve a reentrant atrial pathway. The frequency of
these fluctuations is between 220 and 300 beats per minute. The A-V node and thereafter the ventricles are generally activated every second or every third atrial impulse
(2:1 or 3:1 heart block).
9.4.7 CARDIAC REENTRY
Under certain conditions, the electric depolarization can conduct back into the atrium
from where it immediately conducts over the His bundle back into the ventricles.