

83
Wavelet Transform
1
0.8
0.6
0.4
8
1 0
Signal in time
0.2
0
–0.2
–0.4
–0.6
–0.8
–1
0
2
4
6
Time
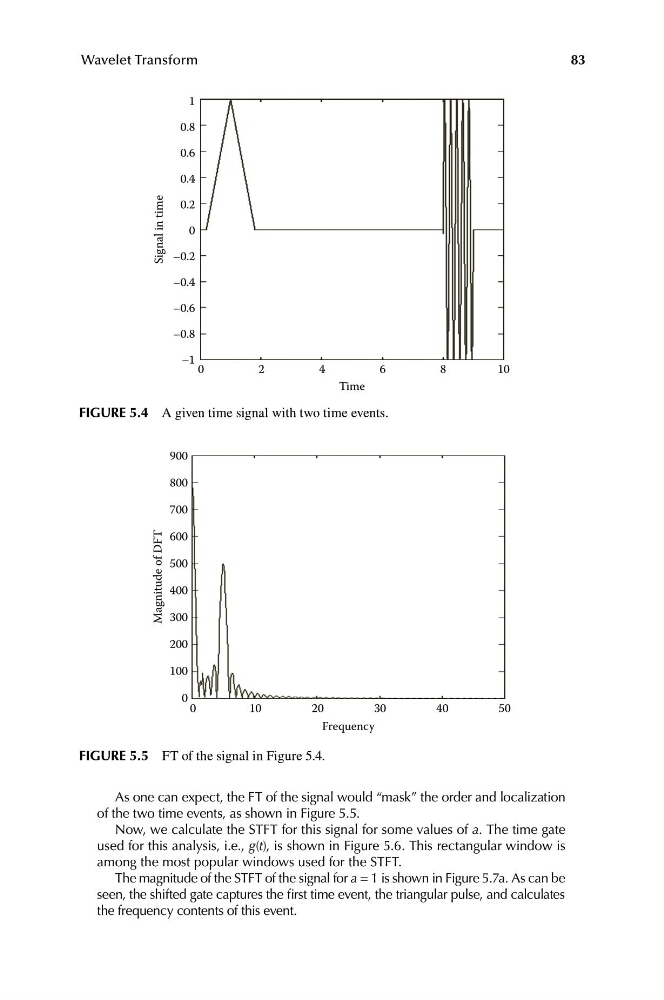
FIGURE 5.4 A given time signal with two time events.
900
800
700
40
50
Magnitude of DFT
600
500
400
300
200
100
0
0
1 0
2 0
3 0
Frequency
FIGURE 5.5 FT of the signal in Figure 5.4.
As one can expect, the FT of the signal would “mask” the order and localization
of the two time events, as shown in Figure 5.5.
Now, we calculate the STFT for this signal for some values of a. The time gate
used for this analysis, i.e., g(t), is shown in Figure 5.6. This rectangular window is
among the most popular windows used for the STFT.
The magnitude of the STFT of the signal for a = 1 is shown in Figure 5.7a. As can be
seen, the shifted gate captures the first time event, the triangular pulse, and calculates
the frequency contents of this event.
Wavelet Transform
1
0.8
0.6
0.4
8
1 0
Signal in time
0.2
0
–0.2
–0.4
–0.6
–0.8
–1
0
2
4
6
Time
FIGURE 5.4 A given time signal with two time events.
900
800
700
40
50
Magnitude of DFT
600
500
400
300
200
100
0
0
1 0
2 0
3 0
Frequency
FIGURE 5.5 FT of the signal in Figure 5.4.
As one can expect, the FT of the signal would “mask” the order and localization
of the two time events, as shown in Figure 5.5.
Now, we calculate the STFT for this signal for some values of a. The time gate
used for this analysis, i.e., g(t), is shown in Figure 5.6. This rectangular window is
among the most popular windows used for the STFT.
The magnitude of the STFT of the signal for a = 1 is shown in Figure 5.7a. As can be
seen, the shifted gate captures the first time event, the triangular pulse, and calculates
the frequency contents of this event.