

overlap in harvesting, stocking of cages is performed annually with half of the
dedicated cages for each species as follows:
• European sea bass (Dicentrarchus labrax) a total of 8 cages; stocking 1 cage per
month in February, March, April and May every year;
• Greater amberjack (Seriola dumerili) a total of 10 cages; stocking 5 cages in
July every year;
• Meagre (Argyrosomus regius) a total of 10 cages; stocking five cages in October
every year.
The 2 remaining fish cages serve as backup units. The stocking with fry will be
followed by a rearing period of 2 years until market-size is reached (European sea
bass 0.6 kg, greater amberjack 3 kg, meagre 2.5 kg). Fish will be fed with artificial
feeds delivered by the automated feeding system. The amount of feed is based
on the demand. Feeds will be transferred from cargo boats directly to the satellites
and the silos will be loaded monthly.
Fish harvesting from the cages will be performed with a fish-pump mounted on a
working barge and the harvested biomass will be transported to the central unit. The
same fish-pump is used to upload the fish to the aquaculture module on the central
platform (TROPOS 2013c).
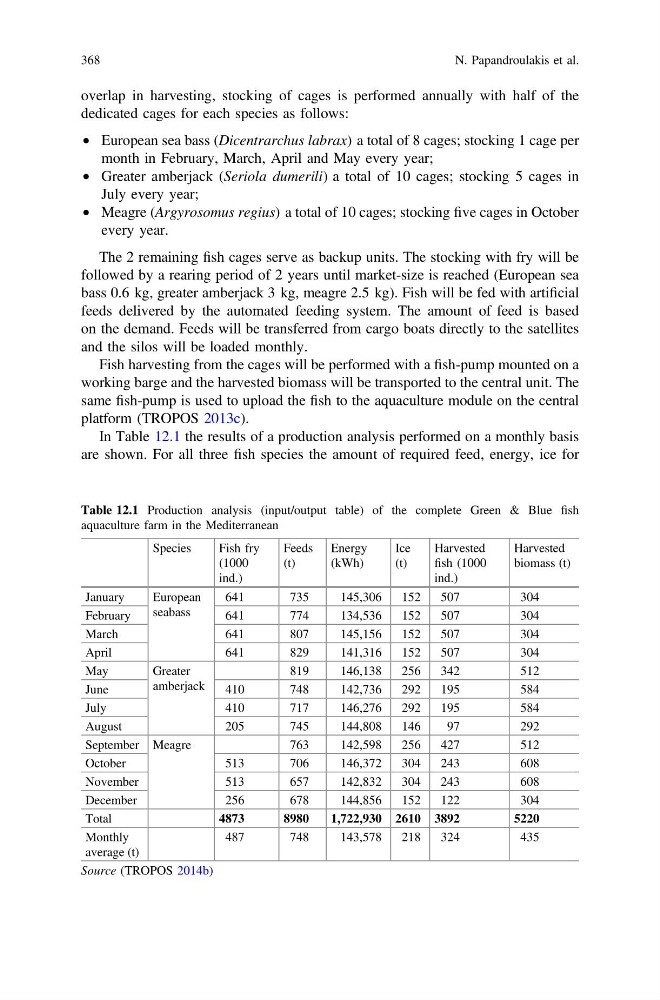
In Table 12.1 the results of a production analysis performed on a monthly basis
are shown. For all three fish species the amount of required feed, energy, ice for
Table 12.1 Production analysis (input/output table) of the complete Green & Blue fish
aquaculture farm in the Mediterranean
Species
Fish fry
(1000
ind.)
Feeds
(t)
Energy
(kWh)
Ice
(t)
Harvested
fish (1000
ind.)
Harvested
biomass (t)
January
European
seabass
641
735
145,306
152
507
304
February
641
774
134,536
152
507
304
March
641
807
145,156
152
507
304
April
641
829
141,316
152
507
304
May
Greater
amberjack
819
146,138
256
342
512
June
410
748
142,736
292
195
584
July
410
717
146,276
292
195
584
August
205
745
144,808
146
97
292
September Meagre
763
142,598
256
427
512
October
513
706
146,372
304
243
608
November
513
657
142,832
304
243
608
December
256
678
144,856
152
122
304
Total
4873
8980
1,722,930 2610 3892
5220
Monthly
average (t)
487
748
143,578
218
324
435
Source (TROPOS 2014b)
368
N. Papandroulakis et al.
dedicated cages for each species as follows:
• European sea bass (Dicentrarchus labrax) a total of 8 cages; stocking 1 cage per
month in February, March, April and May every year;
• Greater amberjack (Seriola dumerili) a total of 10 cages; stocking 5 cages in
July every year;
• Meagre (Argyrosomus regius) a total of 10 cages; stocking five cages in October
every year.
The 2 remaining fish cages serve as backup units. The stocking with fry will be
followed by a rearing period of 2 years until market-size is reached (European sea
bass 0.6 kg, greater amberjack 3 kg, meagre 2.5 kg). Fish will be fed with artificial
feeds delivered by the automated feeding system. The amount of feed is based
on the demand. Feeds will be transferred from cargo boats directly to the satellites
and the silos will be loaded monthly.
Fish harvesting from the cages will be performed with a fish-pump mounted on a
working barge and the harvested biomass will be transported to the central unit. The
same fish-pump is used to upload the fish to the aquaculture module on the central
platform (TROPOS 2013c).
In Table 12.1 the results of a production analysis performed on a monthly basis
are shown. For all three fish species the amount of required feed, energy, ice for
Table 12.1 Production analysis (input/output table) of the complete Green & Blue fish
aquaculture farm in the Mediterranean
Species
Fish fry
(1000
ind.)
Feeds
(t)
Energy
(kWh)
Ice
(t)
Harvested
fish (1000
ind.)
Harvested
biomass (t)
January
European
seabass
641
735
145,306
152
507
304
February
641
774
134,536
152
507
304
March
641
807
145,156
152
507
304
April
641
829
141,316
152
507
304
May
Greater
amberjack
819
146,138
256
342
512
June
410
748
142,736
292
195
584
July
410
717
146,276
292
195
584
August
205
745
144,808
146
97
292
September Meagre
763
142,598
256
427
512
October
513
706
146,372
304
243
608
November
513
657
142,832
304
243
608
December
256
678
144,856
152
122
304
Total
4873
8980
1,722,930 2610 3892
5220
Monthly
average (t)
487
748
143,578
218
324
435
Source (TROPOS 2014b)
368
N. Papandroulakis et al.