

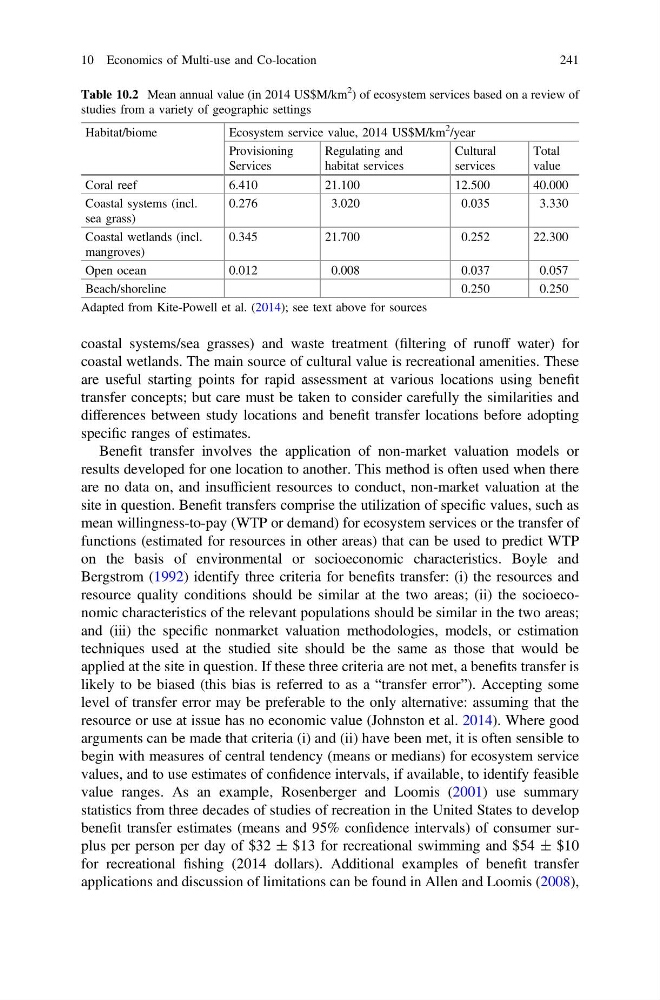
coastal systems/sea grasses) and waste treatment (filtering of runoff water) for
coastal wetlands. The main source of cultural value is recreational amenities. These
are useful starting points for rapid assessment at various locations using benefit
transfer concepts; but care must be taken to consider carefully the similarities and
differences between study locations and benefit transfer locations before adopting
specific ranges of estimates.
Benefit transfer involves the application of non-market valuation models or
results developed for one location to another. This method is often used when there
are no data on, and insufficient resources to conduct, non-market valuation at the
site in question. Benefit transfers comprise the utilization of specific values, such as
mean willingness-to-pay (WTP or demand) for ecosystem services or the transfer of
functions (estimated for resources in other areas) that can be used to predict WTP
on the basis of environmental or socioeconomic characteristics. Boyle and
Bergstrom (1992) identify three criteria for benefits transfer: (i) the resources and
resource quality conditions should be similar at the two areas; (ii) the socioeconomic characteristics of the relevant populations should be similar in the two areas;
and (iii) the specific nonmarket valuation methodologies, models, or estimation
techniques used at the studied site should be the same as those that would be
applied at the site in question. If these three criteria are not met, a benefits transfer is
likely to be biased (this bias is referred to as a “transfer error”). Accepting some
level of transfer error may be preferable to the only alternative: assuming that the
resource or use at issue has no economic value (Johnston et al. 2014). Where good
arguments can be made that criteria (i) and (ii) have been met, it is often sensible to
begin with measures of central tendency (means or medians) for ecosystem service
values, and to use estimates of confidence intervals, if available, to identify feasible
value ranges. As an example, Rosenberger and Loomis (2001) use summary
statistics from three decades of studies of recreation in the United States to develop
benefit transfer estimates (means and 95% confidence intervals) of consumer surplus per person per day of $32 ± $13 for recreational swimming and $54 ± $10
for recreational fishing (2014 dollars). Additional examples of benefit transfer
applications and discussion of limitations can be found in Allen and Loomis (2008),
Table 10.2 Mean annual value (in 2014 US$M/km
2
) of ecosystem services based on a review of
studies from a variety of geographic settings
Habitat/biome
Ecosystem service value, 2014 US$M/km
2
/year
Provisioning
Services
Regulating and
habitat services
Cultural
services
Total
value
Coral reef
6.410
21.100
12.500
40.000
Coastal systems (incl.
sea grass)
0.276
3.020
0.035
3.330
Coastal wetlands (incl.
mangroves)
0.345
21.700
0.252
22.300
Open ocean
0.012
0.008
0.037
0.057
Beach/shoreline
0.250
0.250
Adapted from Kite-Powell et al. (2014); see text above for sources
10 Economics of Multi-use and Co-location
241
coastal wetlands. The main source of cultural value is recreational amenities. These
are useful starting points for rapid assessment at various locations using benefit
transfer concepts; but care must be taken to consider carefully the similarities and
differences between study locations and benefit transfer locations before adopting
specific ranges of estimates.
Benefit transfer involves the application of non-market valuation models or
results developed for one location to another. This method is often used when there
are no data on, and insufficient resources to conduct, non-market valuation at the
site in question. Benefit transfers comprise the utilization of specific values, such as
mean willingness-to-pay (WTP or demand) for ecosystem services or the transfer of
functions (estimated for resources in other areas) that can be used to predict WTP
on the basis of environmental or socioeconomic characteristics. Boyle and
Bergstrom (1992) identify three criteria for benefits transfer: (i) the resources and
resource quality conditions should be similar at the two areas; (ii) the socioeconomic characteristics of the relevant populations should be similar in the two areas;
and (iii) the specific nonmarket valuation methodologies, models, or estimation
techniques used at the studied site should be the same as those that would be
applied at the site in question. If these three criteria are not met, a benefits transfer is
likely to be biased (this bias is referred to as a “transfer error”). Accepting some
level of transfer error may be preferable to the only alternative: assuming that the
resource or use at issue has no economic value (Johnston et al. 2014). Where good
arguments can be made that criteria (i) and (ii) have been met, it is often sensible to
begin with measures of central tendency (means or medians) for ecosystem service
values, and to use estimates of confidence intervals, if available, to identify feasible
value ranges. As an example, Rosenberger and Loomis (2001) use summary
statistics from three decades of studies of recreation in the United States to develop
benefit transfer estimates (means and 95% confidence intervals) of consumer surplus per person per day of $32 ± $13 for recreational swimming and $54 ± $10
for recreational fishing (2014 dollars). Additional examples of benefit transfer
applications and discussion of limitations can be found in Allen and Loomis (2008),
Table 10.2 Mean annual value (in 2014 US$M/km
2
) of ecosystem services based on a review of
studies from a variety of geographic settings
Habitat/biome
Ecosystem service value, 2014 US$M/km
2
/year
Provisioning
Services
Regulating and
habitat services
Cultural
services
Total
value
Coral reef
6.410
21.100
12.500
40.000
Coastal systems (incl.
sea grass)
0.276
3.020
0.035
3.330
Coastal wetlands (incl.
mangroves)
0.345
21.700
0.252
22.300
Open ocean
0.012
0.008
0.037
0.057
Beach/shoreline
0.250
0.250
Adapted from Kite-Powell et al. (2014); see text above for sources
10 Economics of Multi-use and Co-location
241