

34
2 Front-End Electronics
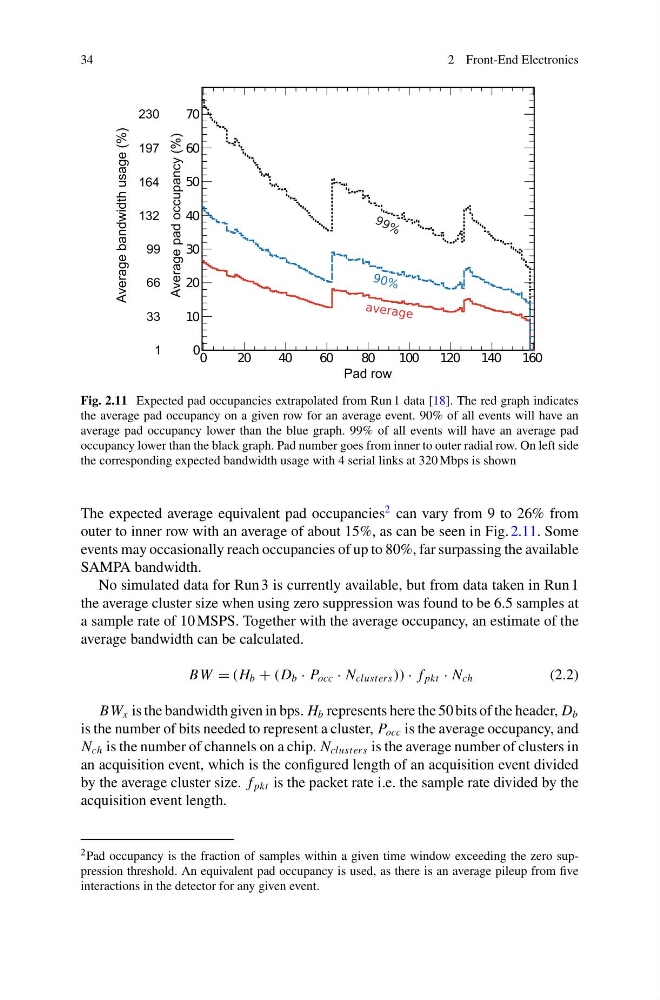
Fig. 2.11 Expected pad occupancies extrapolated from Run 1 data [18]. The red graph indicates
the average pad occupancy on a given row for an average event. 90% of all events will have an
average pad occupancy lower than the blue graph. 99% of all events will have an average pad
occupancy lower than the black graph. Pad number goes from inner to outer radial row. On left side
the corresponding expected bandwidth usage with 4 serial links at 320 Mbps is shown
The expected average equivalent pad occupancies
2 can vary from 9 to 26% from
outer to inner row with an average of about 15%, as can be seen in Fig. 2.11. Some
events may occasionally reach occupancies of up to 80%, far surpassing the available
SAMPA bandwidth.
No simulated data for Run 3 is currently available, but from data taken in Run 1
the average cluster size when using zero suppression was found to be 6.5 samples at
a sample rate of 10 MSPS. Together with the average occupancy, an estimate of the
average bandwidth can be calculated.
BW = (H b + (D b · P occ · N cluster s )) · f pkt · N ch
(2.2)
BW x is the bandwidth given in bps. H b represents here the 50 bits of the header, D b
is the number of bits needed to represent a cluster, P occ is the average occupancy, and
N ch is the number of channels on a chip. N cluster s is the average number of clusters in
an acquisition event, which is the configured length of an acquisition event divided
by the average cluster size. f pkt is the packet rate i.e. the sample rate divided by the
acquisition event length.
2 Pad occupancy is the fraction of samples within a given time window exceeding the zero suppression threshold. An equivalent pad occupancy is used, as there is an average pileup from five
interactions in the detector for any given event.
2 Front-End Electronics
Fig. 2.11 Expected pad occupancies extrapolated from Run 1 data [18]. The red graph indicates
the average pad occupancy on a given row for an average event. 90% of all events will have an
average pad occupancy lower than the blue graph. 99% of all events will have an average pad
occupancy lower than the black graph. Pad number goes from inner to outer radial row. On left side
the corresponding expected bandwidth usage with 4 serial links at 320 Mbps is shown
The expected average equivalent pad occupancies
2 can vary from 9 to 26% from
outer to inner row with an average of about 15%, as can be seen in Fig. 2.11. Some
events may occasionally reach occupancies of up to 80%, far surpassing the available
SAMPA bandwidth.
No simulated data for Run 3 is currently available, but from data taken in Run 1
the average cluster size when using zero suppression was found to be 6.5 samples at
a sample rate of 10 MSPS. Together with the average occupancy, an estimate of the
average bandwidth can be calculated.
BW = (H b + (D b · P occ · N cluster s )) · f pkt · N ch
(2.2)
BW x is the bandwidth given in bps. H b represents here the 50 bits of the header, D b
is the number of bits needed to represent a cluster, P occ is the average occupancy, and
N ch is the number of channels on a chip. N cluster s is the average number of clusters in
an acquisition event, which is the configured length of an acquisition event divided
by the average cluster size. f pkt is the packet rate i.e. the sample rate divided by the
acquisition event length.
2 Pad occupancy is the fraction of samples within a given time window exceeding the zero suppression threshold. An equivalent pad occupancy is used, as there is an average pileup from five
interactions in the detector for any given event.