

22
1 Electromagnetics for Zero-Index Metamaterials
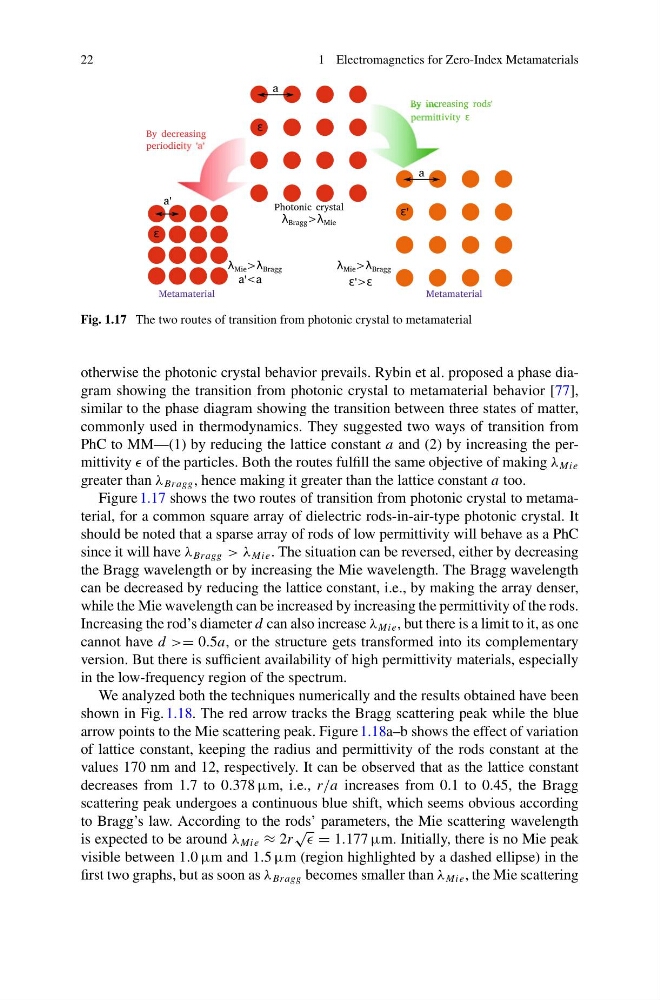
Fig. 1.17 The two routes of transition from photonic crystal to metamaterial
otherwise the photonic crystal behavior prevails. Rybin et al. proposed a phase diagram showing the transition from photonic crystal to metamaterial behavior [77],
similar to the phase diagram showing the transition between three states of matter,
commonly used in thermodynamics. They suggested two ways of transition from
PhC to MM—(1) by reducing the lattice constant a and (2) by increasing the permittivity of the particles. Both the routes fulfill the same objective of making λ Mie
greater than λ Bragg , hence making it greater than the lattice constant a too.
Figure 1.17 shows the two routes of transition from photonic crystal to metamaterial, for a common square array of dielectric rods-in-air-type photonic crystal. It
should be noted that a sparse array of rods of low permittivity will behave as a PhC
since it will have λ Bragg > λ Mie . The situation can be reversed, either by decreasing
the Bragg wavelength or by increasing the Mie wavelength. The Bragg wavelength
can be decreased by reducing the lattice constant, i.e., by making the array denser,
while the Mie wavelength can be increased by increasing the permittivity of the rods.
Increasing the rod’s diameter d can also increase λ Mie , but there is a limit to it, as one
cannot have d >= 0.5a, or the structure gets transformed into its complementary
version. But there is sufficient availability of high permittivity materials, especially
in the low-frequency region of the spectrum.
We analyzed both the techniques numerically and the results obtained have been
shown in Fig. 1.18. The red arrow tracks the Bragg scattering peak while the blue
arrow points to the Mie scattering peak. Figure 1.18a–b shows the effect of variation
of lattice constant, keeping the radius and permittivity of the rods constant at the
values 170 nm and 12, respectively. It can be observed that as the lattice constant
decreases from 1.7 to 0.378 µm, i.e., r/a increases from 0.1 to 0.45, the Bragg
scattering peak undergoes a continuous blue shift, which seems obvious according
to Bragg’s law. According to the rods’ parameters, the Mie scattering wavelength
is expected to be around λ Mie ≈ 2r
√
= 1.177 µm. Initially, there is no Mie peak
visible between 1.0 µm and 1.5 µm (region highlighted by a dashed ellipse) in the
first two graphs, but as soon as λ Bragg becomes smaller than λ Mie , the Mie scattering
1 Electromagnetics for Zero-Index Metamaterials
Fig. 1.17 The two routes of transition from photonic crystal to metamaterial
otherwise the photonic crystal behavior prevails. Rybin et al. proposed a phase diagram showing the transition from photonic crystal to metamaterial behavior [77],
similar to the phase diagram showing the transition between three states of matter,
commonly used in thermodynamics. They suggested two ways of transition from
PhC to MM—(1) by reducing the lattice constant a and (2) by increasing the permittivity of the particles. Both the routes fulfill the same objective of making λ Mie
greater than λ Bragg , hence making it greater than the lattice constant a too.
Figure 1.17 shows the two routes of transition from photonic crystal to metamaterial, for a common square array of dielectric rods-in-air-type photonic crystal. It
should be noted that a sparse array of rods of low permittivity will behave as a PhC
since it will have λ Bragg > λ Mie . The situation can be reversed, either by decreasing
the Bragg wavelength or by increasing the Mie wavelength. The Bragg wavelength
can be decreased by reducing the lattice constant, i.e., by making the array denser,
while the Mie wavelength can be increased by increasing the permittivity of the rods.
Increasing the rod’s diameter d can also increase λ Mie , but there is a limit to it, as one
cannot have d >= 0.5a, or the structure gets transformed into its complementary
version. But there is sufficient availability of high permittivity materials, especially
in the low-frequency region of the spectrum.
We analyzed both the techniques numerically and the results obtained have been
shown in Fig. 1.18. The red arrow tracks the Bragg scattering peak while the blue
arrow points to the Mie scattering peak. Figure 1.18a–b shows the effect of variation
of lattice constant, keeping the radius and permittivity of the rods constant at the
values 170 nm and 12, respectively. It can be observed that as the lattice constant
decreases from 1.7 to 0.378 µm, i.e., r/a increases from 0.1 to 0.45, the Bragg
scattering peak undergoes a continuous blue shift, which seems obvious according
to Bragg’s law. According to the rods’ parameters, the Mie scattering wavelength
is expected to be around λ Mie ≈ 2r
√
= 1.177 µm. Initially, there is no Mie peak
visible between 1.0 µm and 1.5 µm (region highlighted by a dashed ellipse) in the
first two graphs, but as soon as λ Bragg becomes smaller than λ Mie , the Mie scattering