

108
4 Nonlinear Optics with Zero-Index Metamaterials
4.6.1.2 Frequency-Domain Computation
To calculate the fundamental and the second-harmonic fields inside the zero-index
medium and the homogeneous silicon medium, frequency-domain computations
have been performed in COMSOL multiphysics. The designs of the computation
regions in the two cases have been shown in Fig. 4.18. The ZIM region is ten periods
long and five periods wide (same as earlier) and has air space of 2.5 µm on both
the sides along the length. An intense plane wave of power 300 MW/m
2 is launched
toward the ZIM from the air region, as indicated in the figure. The reason for such high
power is that the nonlinear susceptibilities can come into play only in intense fields.
The nonlinear second-order susceptibility of silicon used here is χ
(2)
= 15 pm/V
[207]. In the case of homogeneous medium, an equivalent Si slab of the same size
10a × 5a has been taken with the same type of air regions on both sides and the
same input power. The results of the computation have been shown in Figs. 4.19 and
4.20. Figure 4.19a–c presents the case of rods. Figure 4.19a and b presents the 2D
plots showing the distribution of z-component of electric field E z , inside and outside
the metamaterial, for both the fundamental and the second-harmonic waves. The
fundamental wave appears to fade and the second-harmonic appears to grow, which
satisfies the expectation. For a closer inspection of the electric field inside the ZIM,
1D plots have been drawn and shown in Fig. 4.19c. The red and blue curves represent the fundamental and second-harmonic waves, respectively. Since the refractive
index of the ZIM is close to zero, the wavelength inside it is very large. Hence, as a
trough enters the ZIM, it gets stretched along the length of the crystal (dashed red).
The tiny waviness that one sees inside the ZIM arises due to the periodic nature of
the structure and must not be used to predict the fundamental wavelength inside the
ZIM. Similarly, in the case of the second harmonic, a crest gets stretched inside the
ZIM, as shown in Fig. 4.19c by the dashed-blue curve. The overriding wave appears
due to the periodic nature of the structure. It can be noticed that number of overriding
crests or troughs inside the ZIM is ten in each of the two graphs, as the ZIM is ten
periods long. The maximum amplitude of the fundamental field inside the ZIM is
of the order −5 × 10
5 V/m while that of second harmonic is around 2 V/m and the
efficiency of SHG is determined as
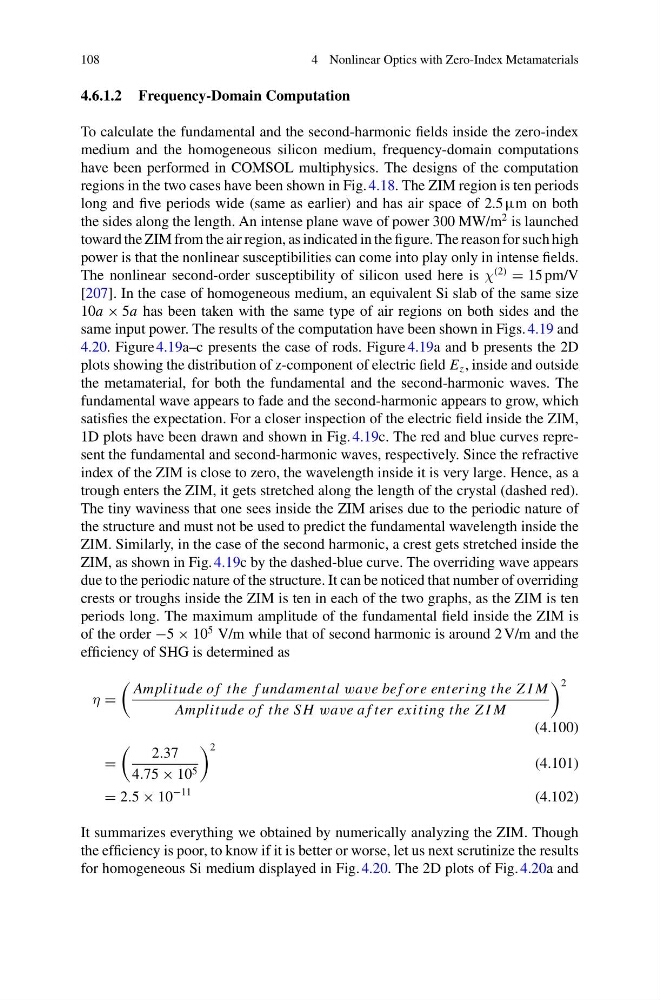
η =
Amplitude o f the f undamental wave bef ore entering the Z I M
Amplitude o f the S H wave a f ter exiting the Z I M
2
(4.100)
=
2.37
4.75 × 10 5
2
(4.101)
= 2.5 × 10
−11
(4.102)
It summarizes everything we obtained by numerically analyzing the ZIM. Though
the efficiency is poor, to know if it is better or worse, let us next scrutinize the results
for homogeneous Si medium displayed in Fig. 4.20. The 2D plots of Fig. 4.20a and
4 Nonlinear Optics with Zero-Index Metamaterials
4.6.1.2 Frequency-Domain Computation
To calculate the fundamental and the second-harmonic fields inside the zero-index
medium and the homogeneous silicon medium, frequency-domain computations
have been performed in COMSOL multiphysics. The designs of the computation
regions in the two cases have been shown in Fig. 4.18. The ZIM region is ten periods
long and five periods wide (same as earlier) and has air space of 2.5 µm on both
the sides along the length. An intense plane wave of power 300 MW/m
2 is launched
toward the ZIM from the air region, as indicated in the figure. The reason for such high
power is that the nonlinear susceptibilities can come into play only in intense fields.
The nonlinear second-order susceptibility of silicon used here is χ
(2)
= 15 pm/V
[207]. In the case of homogeneous medium, an equivalent Si slab of the same size
10a × 5a has been taken with the same type of air regions on both sides and the
same input power. The results of the computation have been shown in Figs. 4.19 and
4.20. Figure 4.19a–c presents the case of rods. Figure 4.19a and b presents the 2D
plots showing the distribution of z-component of electric field E z , inside and outside
the metamaterial, for both the fundamental and the second-harmonic waves. The
fundamental wave appears to fade and the second-harmonic appears to grow, which
satisfies the expectation. For a closer inspection of the electric field inside the ZIM,
1D plots have been drawn and shown in Fig. 4.19c. The red and blue curves represent the fundamental and second-harmonic waves, respectively. Since the refractive
index of the ZIM is close to zero, the wavelength inside it is very large. Hence, as a
trough enters the ZIM, it gets stretched along the length of the crystal (dashed red).
The tiny waviness that one sees inside the ZIM arises due to the periodic nature of
the structure and must not be used to predict the fundamental wavelength inside the
ZIM. Similarly, in the case of the second harmonic, a crest gets stretched inside the
ZIM, as shown in Fig. 4.19c by the dashed-blue curve. The overriding wave appears
due to the periodic nature of the structure. It can be noticed that number of overriding
crests or troughs inside the ZIM is ten in each of the two graphs, as the ZIM is ten
periods long. The maximum amplitude of the fundamental field inside the ZIM is
of the order −5 × 10
5 V/m while that of second harmonic is around 2 V/m and the
efficiency of SHG is determined as
η =
Amplitude o f the f undamental wave bef ore entering the Z I M
Amplitude o f the S H wave a f ter exiting the Z I M
2
(4.100)
=
2.37
4.75 × 10 5
2
(4.101)
= 2.5 × 10
−11
(4.102)
It summarizes everything we obtained by numerically analyzing the ZIM. Though
the efficiency is poor, to know if it is better or worse, let us next scrutinize the results
for homogeneous Si medium displayed in Fig. 4.20. The 2D plots of Fig. 4.20a and