

G.4 Product Risk Assessment
317
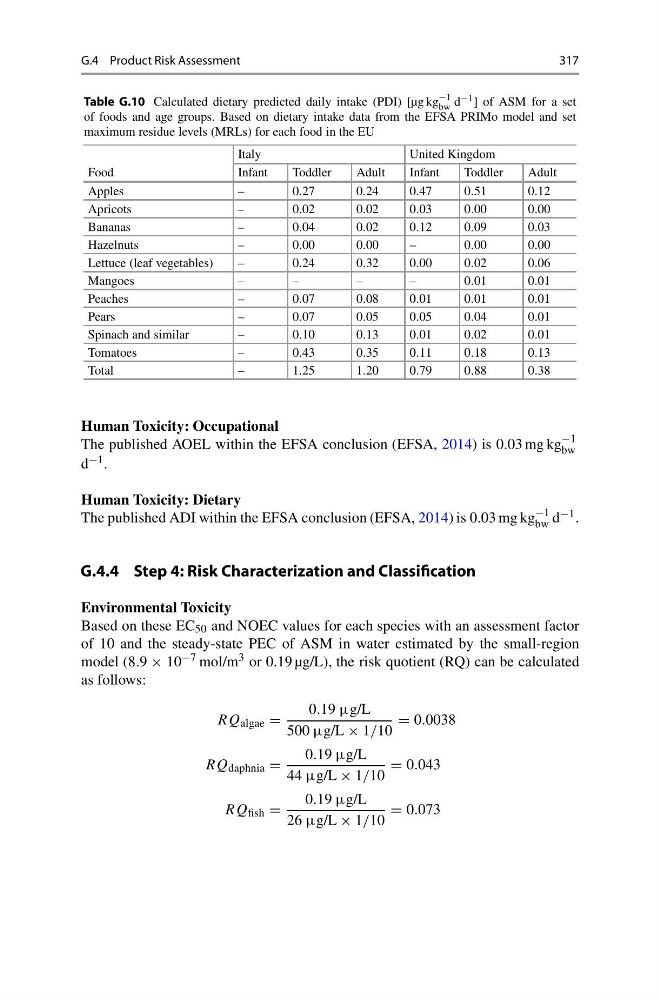
Table G.10 Calculated dietary predicted daily intake (PDI) [µg kg
−1
bw d −1 ] of ASM for a set
of foods and age groups. Based on dietary intake data from the EFSA PRIMo model and set
maximum residue levels (MRLs) for each food in the EU
Italy
United Kingdom
Food
Infant
Toddler
Adult
Infant
Toddler
Adult
Apples
–
0.27
0.24
0.47
0.51
0.12
Apricots
–
0.02
0.02
0.03
0.00
0.00
Bananas
–
0.04
0.02
0.12
0.09
0.03
Hazelnuts
–
0.00
0.00
–
0.00
0.00
Lettuce (leaf vegetables)
–
0.24
0.32
0.00
0.02
0.06
Mangoes
–
–
–
–
0.01
0.01
Peaches
–
0.07
0.08
0.01
0.01
0.01
Pears
–
0.07
0.05
0.05
0.04
0.01
Spinach and similar
–
0.10
0.13
0.01
0.02
0.01
Tomatoes
–
0.43
0.35
0.11
0.18
0.13
Total
–
1.25
1.20
0.79
0.88
0.38
Human Toxicity: Occupational
The published AOEL within the EFSA conclusion (EFSA, 2014) is 0.03 mg kg
−1
bw
d −1 .
Human Toxicity: Dietary
The published ADI within the EFSA conclusion (EFSA, 2014) is 0.03 mg kg
−1
bw d −1 .
G.4.4 Step 4: Risk Characterization and Classification
Environmental Toxicity
Based on these EC 50 and NOEC values for each species with an assessment factor
of 10 and the steady-state PEC of ASM in water estimated by the small-region
model (8.9 × 10 −7 mol/m 3 or 0.19 µg/L), the risk quotient (RQ) can be calculated
as follows:
RQ algae =
0.19 µg/L
500 µg/L × 1/10
= 0.0038
RQ daphnia =
0.19 µg/L
44 µg/L × 1/10
= 0.043
RQ fish =
0.19 µg/L
26 µg/L × 1/10
= 0.073
317
Table G.10 Calculated dietary predicted daily intake (PDI) [µg kg
−1
bw d −1 ] of ASM for a set
of foods and age groups. Based on dietary intake data from the EFSA PRIMo model and set
maximum residue levels (MRLs) for each food in the EU
Italy
United Kingdom
Food
Infant
Toddler
Adult
Infant
Toddler
Adult
Apples
–
0.27
0.24
0.47
0.51
0.12
Apricots
–
0.02
0.02
0.03
0.00
0.00
Bananas
–
0.04
0.02
0.12
0.09
0.03
Hazelnuts
–
0.00
0.00
–
0.00
0.00
Lettuce (leaf vegetables)
–
0.24
0.32
0.00
0.02
0.06
Mangoes
–
–
–
–
0.01
0.01
Peaches
–
0.07
0.08
0.01
0.01
0.01
Pears
–
0.07
0.05
0.05
0.04
0.01
Spinach and similar
–
0.10
0.13
0.01
0.02
0.01
Tomatoes
–
0.43
0.35
0.11
0.18
0.13
Total
–
1.25
1.20
0.79
0.88
0.38
Human Toxicity: Occupational
The published AOEL within the EFSA conclusion (EFSA, 2014) is 0.03 mg kg
−1
bw
d −1 .
Human Toxicity: Dietary
The published ADI within the EFSA conclusion (EFSA, 2014) is 0.03 mg kg
−1
bw d −1 .
G.4.4 Step 4: Risk Characterization and Classification
Environmental Toxicity
Based on these EC 50 and NOEC values for each species with an assessment factor
of 10 and the steady-state PEC of ASM in water estimated by the small-region
model (8.9 × 10 −7 mol/m 3 or 0.19 µg/L), the risk quotient (RQ) can be calculated
as follows:
RQ algae =
0.19 µg/L
500 µg/L × 1/10
= 0.0038
RQ daphnia =
0.19 µg/L
44 µg/L × 1/10
= 0.043
RQ fish =
0.19 µg/L
26 µg/L × 1/10
= 0.073