

300
F Reaction Calorimetry
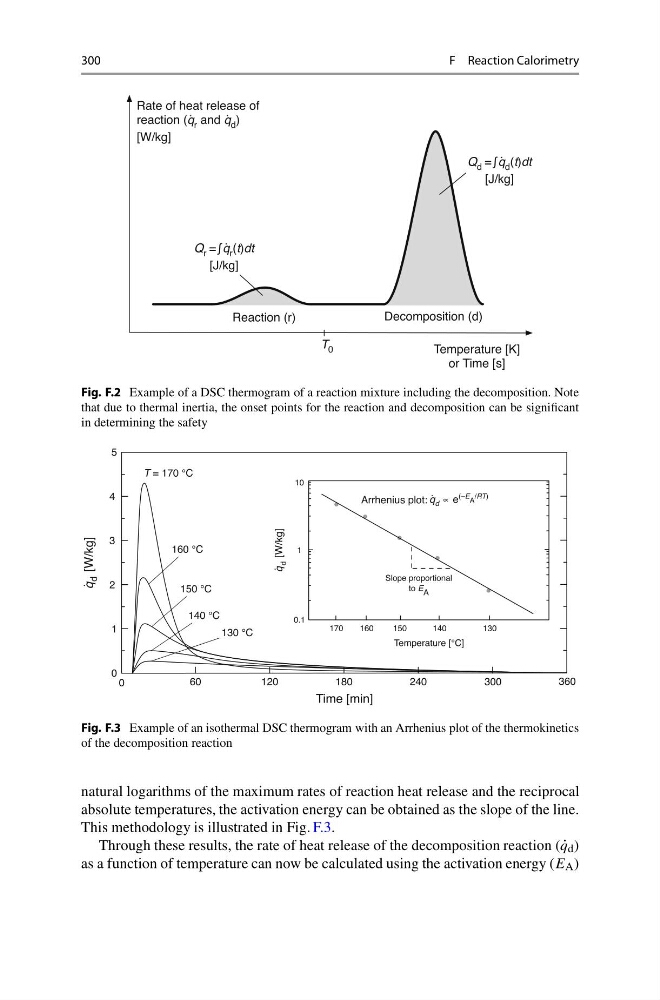
Fig. F.2 Example of a DSC thermogram of a reaction mixture including the decomposition. Note
that due to thermal inertia, the onset points for the reaction and decomposition can be significant
in determining the safety
Fig. F.3 Example of an isothermal DSC thermogram with an Arrhenius plot of the thermokinetics
of the decomposition reaction
natural logarithms of the maximum rates of reaction heat release and the reciprocal
absolute temperatures, the activation energy can be obtained as the slope of the line.
This methodology is illustrated in Fig. F.3.
Through these results, the rate of heat release of the decomposition reaction ( ˙
q d )
as a function of temperature can now be calculated using the activation energy (E A )
F Reaction Calorimetry
Fig. F.2 Example of a DSC thermogram of a reaction mixture including the decomposition. Note
that due to thermal inertia, the onset points for the reaction and decomposition can be significant
in determining the safety
Fig. F.3 Example of an isothermal DSC thermogram with an Arrhenius plot of the thermokinetics
of the decomposition reaction
natural logarithms of the maximum rates of reaction heat release and the reciprocal
absolute temperatures, the activation energy can be obtained as the slope of the line.
This methodology is illustrated in Fig. F.3.
Through these results, the rate of heat release of the decomposition reaction ( ˙
q d )
as a function of temperature can now be calculated using the activation energy (E A )