

F.2 Differential Scanning Calorimetry
299
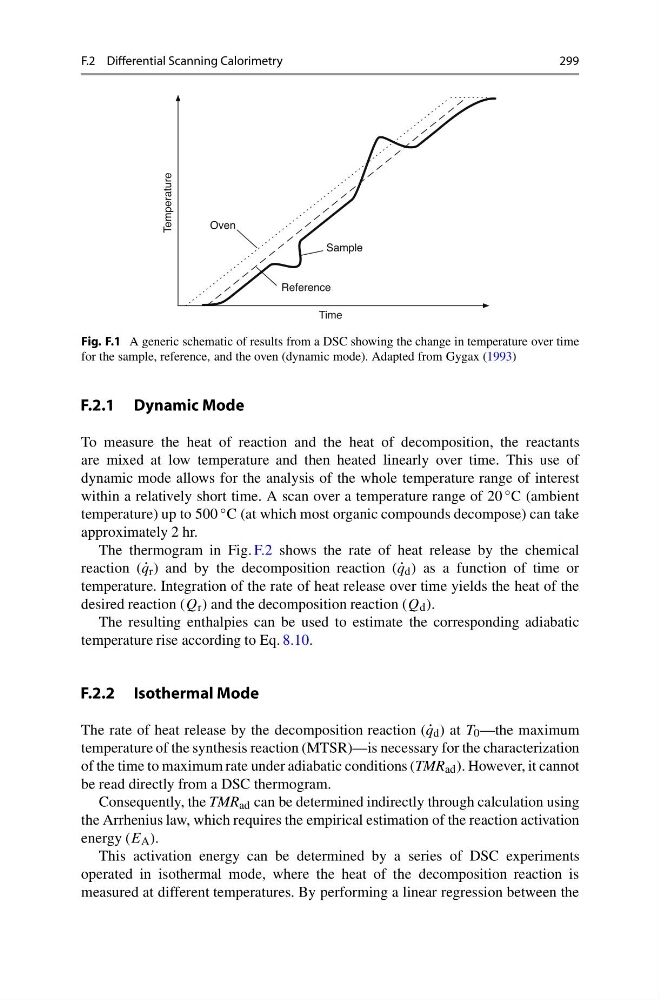
Fig. F.1 A generic schematic of results from a DSC showing the change in temperature over time
for the sample, reference, and the oven (dynamic mode). Adapted from Gygax (1993)
F.2.1 Dynamic Mode
To measure the heat of reaction and the heat of decomposition, the reactants
are mixed at low temperature and then heated linearly over time. This use of
dynamic mode allows for the analysis of the whole temperature range of interest
within a relatively short time. A scan over a temperature range of 20 ◦ C (ambient
temperature) up to 500 ◦ C (at which most organic compounds decompose) can take
approximately 2 hr.
The thermogram in Fig. F.2 shows the rate of heat release by the chemical
reaction ( ˙
q r ) and by the decomposition reaction ( ˙
q d ) as a function of time or
temperature. Integration of the rate of heat release over time yields the heat of the
desired reaction (Q r ) and the decomposition reaction (Q d ).
The resulting enthalpies can be used to estimate the corresponding adiabatic
temperature rise according to Eq. 8.10.
F.2.2 Isothermal Mode
The rate of heat release by the decomposition reaction ( ˙
q d ) at T 0 —the maximum
temperature of the synthesis reaction (MTSR)—is necessary for the characterization
of the time to maximum rate under adiabatic conditions (TMR ad ). However, it cannot
be read directly from a DSC thermogram.
Consequently, the TMR ad can be determined indirectly through calculation using
the Arrhenius law, which requires the empirical estimation of the reaction activation
energy (E A ).
This activation energy can be determined by a series of DSC experiments
operated in isothermal mode, where the heat of the decomposition reaction is
measured at different temperatures. By performing a linear regression between the
299
Fig. F.1 A generic schematic of results from a DSC showing the change in temperature over time
for the sample, reference, and the oven (dynamic mode). Adapted from Gygax (1993)
F.2.1 Dynamic Mode
To measure the heat of reaction and the heat of decomposition, the reactants
are mixed at low temperature and then heated linearly over time. This use of
dynamic mode allows for the analysis of the whole temperature range of interest
within a relatively short time. A scan over a temperature range of 20 ◦ C (ambient
temperature) up to 500 ◦ C (at which most organic compounds decompose) can take
approximately 2 hr.
The thermogram in Fig. F.2 shows the rate of heat release by the chemical
reaction ( ˙
q r ) and by the decomposition reaction ( ˙
q d ) as a function of time or
temperature. Integration of the rate of heat release over time yields the heat of the
desired reaction (Q r ) and the decomposition reaction (Q d ).
The resulting enthalpies can be used to estimate the corresponding adiabatic
temperature rise according to Eq. 8.10.
F.2.2 Isothermal Mode
The rate of heat release by the decomposition reaction ( ˙
q d ) at T 0 —the maximum
temperature of the synthesis reaction (MTSR)—is necessary for the characterization
of the time to maximum rate under adiabatic conditions (TMR ad ). However, it cannot
be read directly from a DSC thermogram.
Consequently, the TMR ad can be determined indirectly through calculation using
the Arrhenius law, which requires the empirical estimation of the reaction activation
energy (E A ).
This activation energy can be determined by a series of DSC experiments
operated in isothermal mode, where the heat of the decomposition reaction is
measured at different temperatures. By performing a linear regression between the