

8.3 Assessing Thermal Risks
211
8.3.4 Probability of a Thermal Runaway
For reactions with medium and high thermal impact potentials (T ad > 50 K), the
probability of occurrence should also be analyzed. The time to maximum rate under
adiabatic conditions (TMR ad ) according to Eq. 8.12 can be used as an indicator for
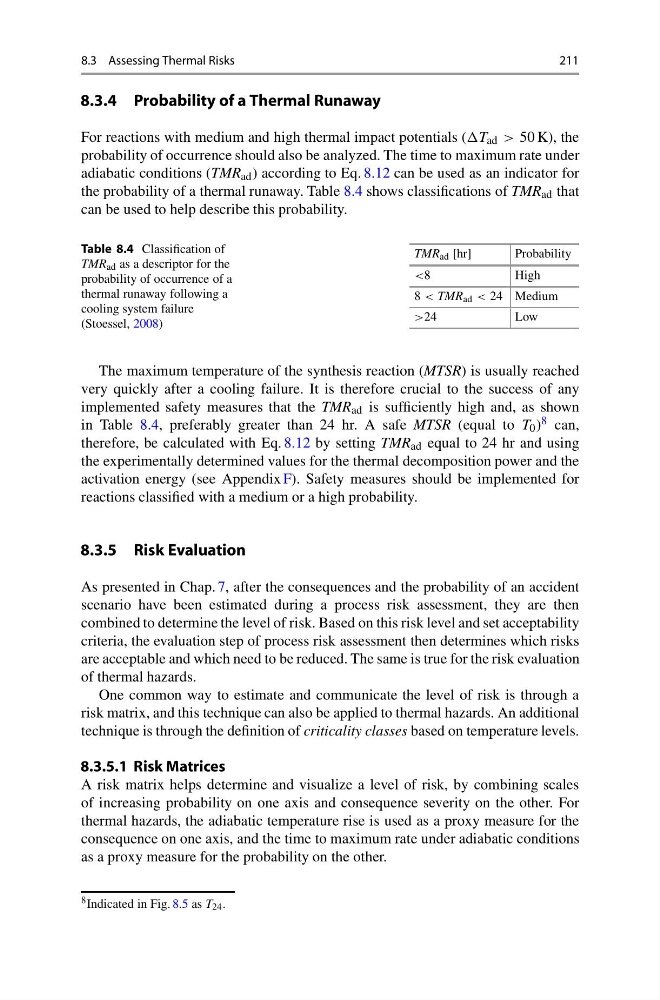
the probability of a thermal runaway. Table 8.4 shows classifications of TMR ad that
can be used to help describe this probability.
Table 8.4 Classification of
TMR ad as a descriptor for the
probability of occurrence of a
thermal runaway following a
cooling system failure
(Stoessel, 2008)
TMR ad [hr]
Probability
<8
High
8 < TMR ad < 24 Medium
>24
Low
The maximum temperature of the synthesis reaction (MTSR) is usually reached
very quickly after a cooling failure. It is therefore crucial to the success of any
implemented safety measures that the TMR ad is sufficiently high and, as shown
in Table 8.4, preferably greater than 24 hr. A safe MTSR (equal to T 0 ) 8 can,
therefore, be calculated with Eq. 8.12 by setting TMR ad equal to 24 hr and using
the experimentally determined values for the thermal decomposition power and the
activation energy (see Appendix F). Safety measures should be implemented for
reactions classified with a medium or a high probability.
8.3.5 Risk Evaluation
As presented in Chap. 7, after the consequences and the probability of an accident
scenario have been estimated during a process risk assessment, they are then
combined to determine the level of risk. Based on this risk level and set acceptability
criteria, the evaluation step of process risk assessment then determines which risks
are acceptable and which need to be reduced. The same is true for the risk evaluation
of thermal hazards.
One common way to estimate and communicate the level of risk is through a
risk matrix, and this technique can also be applied to thermal hazards. An additional
technique is through the definition of criticality classes based on temperature levels.
8.3.5.1 Risk Matrices
A risk matrix helps determine and visualize a level of risk, by combining scales
of increasing probability on one axis and consequence severity on the other. For
thermal hazards, the adiabatic temperature rise is used as a proxy measure for the
consequence on one axis, and the time to maximum rate under adiabatic conditions
as a proxy measure for the probability on the other.
8 Indicated in Fig. 8.5 as T 24 .
211
8.3.4 Probability of a Thermal Runaway
For reactions with medium and high thermal impact potentials (T ad > 50 K), the
probability of occurrence should also be analyzed. The time to maximum rate under
adiabatic conditions (TMR ad ) according to Eq. 8.12 can be used as an indicator for
the probability of a thermal runaway. Table 8.4 shows classifications of TMR ad that
can be used to help describe this probability.
Table 8.4 Classification of
TMR ad as a descriptor for the
probability of occurrence of a
thermal runaway following a
cooling system failure
(Stoessel, 2008)
TMR ad [hr]
Probability
<8
High
8 < TMR ad < 24 Medium
>24
Low
The maximum temperature of the synthesis reaction (MTSR) is usually reached
very quickly after a cooling failure. It is therefore crucial to the success of any
implemented safety measures that the TMR ad is sufficiently high and, as shown
in Table 8.4, preferably greater than 24 hr. A safe MTSR (equal to T 0 ) 8 can,
therefore, be calculated with Eq. 8.12 by setting TMR ad equal to 24 hr and using
the experimentally determined values for the thermal decomposition power and the
activation energy (see Appendix F). Safety measures should be implemented for
reactions classified with a medium or a high probability.
8.3.5 Risk Evaluation
As presented in Chap. 7, after the consequences and the probability of an accident
scenario have been estimated during a process risk assessment, they are then
combined to determine the level of risk. Based on this risk level and set acceptability
criteria, the evaluation step of process risk assessment then determines which risks
are acceptable and which need to be reduced. The same is true for the risk evaluation
of thermal hazards.
One common way to estimate and communicate the level of risk is through a
risk matrix, and this technique can also be applied to thermal hazards. An additional
technique is through the definition of criticality classes based on temperature levels.
8.3.5.1 Risk Matrices
A risk matrix helps determine and visualize a level of risk, by combining scales
of increasing probability on one axis and consequence severity on the other. For
thermal hazards, the adiabatic temperature rise is used as a proxy measure for the
consequence on one axis, and the time to maximum rate under adiabatic conditions
as a proxy measure for the probability on the other.
8 Indicated in Fig. 8.5 as T 24 .