

7.7 Risk Evaluation (Step 5)
183
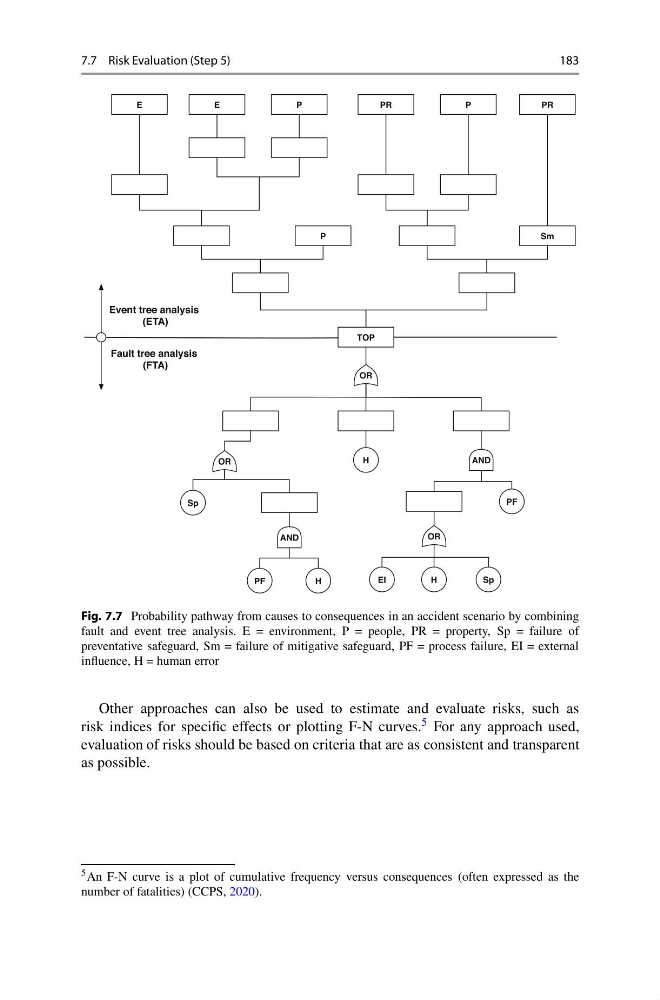
Fig. 7.7 Probability pathway from causes to consequences in an accident scenario by combining
fault and event tree analysis. E = environment, P = people, PR = property, Sp = failure of
preventative safeguard, Sm = failure of mitigative safeguard, PF = process failure, EI = external
influence, H = human error
Other approaches can also be used to estimate and evaluate risks, such as
risk indices for specific effects or plotting F-N curves. 5 For any approach used,
evaluation of risks should be based on criteria that are as consistent and transparent
as possible.
5 An F-N curve is a plot of cumulative frequency versus consequences (often expressed as the
number of fatalities) (CCPS, 2020).
183
Fig. 7.7 Probability pathway from causes to consequences in an accident scenario by combining
fault and event tree analysis. E = environment, P = people, PR = property, Sp = failure of
preventative safeguard, Sm = failure of mitigative safeguard, PF = process failure, EI = external
influence, H = human error
Other approaches can also be used to estimate and evaluate risks, such as
risk indices for specific effects or plotting F-N curves. 5 For any approach used,
evaluation of risks should be based on criteria that are as consistent and transparent
as possible.
5 An F-N curve is a plot of cumulative frequency versus consequences (often expressed as the
number of fatalities) (CCPS, 2020).