

180
7 Risk Assessment and Management of Chemical Processes
cause failure analysis. More information about these techniques as well as about the
fundamentals of probability can be found in Appendix E.
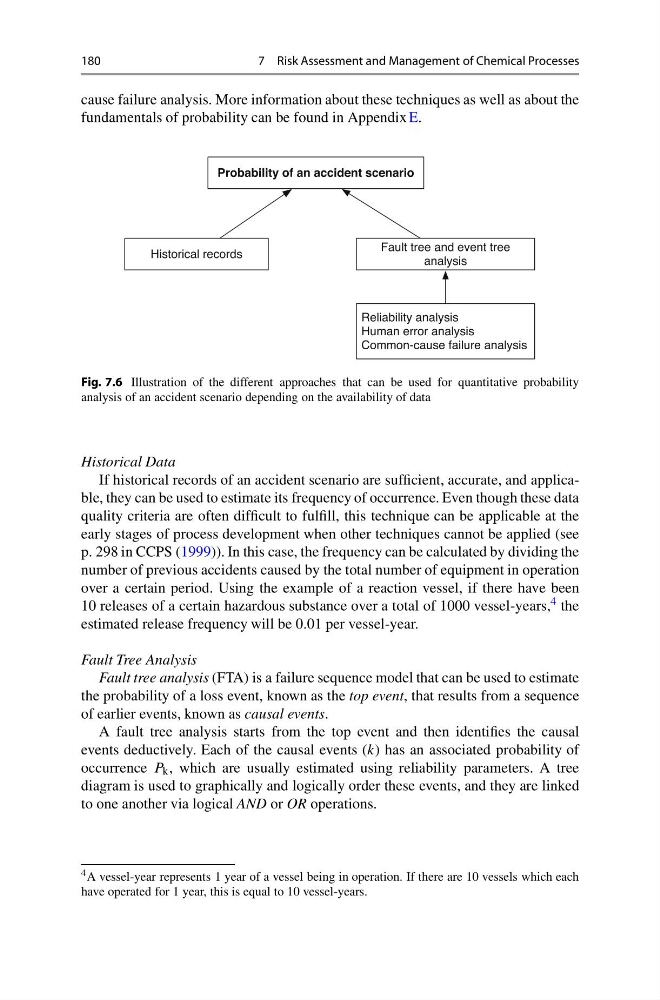
Fig. 7.6 Illustration of the different approaches that can be used for quantitative probability
analysis of an accident scenario depending on the availability of data
Historical Data
If historical records of an accident scenario are sufficient, accurate, and applicable, they can be used to estimate its frequency of occurrence. Even though these data
quality criteria are often difficult to fulfill, this technique can be applicable at the
early stages of process development when other techniques cannot be applied (see
p. 298 in CCPS (1999)). In this case, the frequency can be calculated by dividing the
number of previous accidents caused by the total number of equipment in operation
over a certain period. Using the example of a reaction vessel, if there have been
10 releases of a certain hazardous substance over a total of 1000 vessel-years, 4 the
estimated release frequency will be 0.01 per vessel-year.
Fault Tree Analysis
Fault tree analysis (FTA) is a failure sequence model that can be used to estimate
the probability of a loss event, known as the top event, that results from a sequence
of earlier events, known as causal events.
A fault tree analysis starts from the top event and then identifies the causal
events deductively. Each of the causal events (k) has an associated probability of
occurrence P k , which are usually estimated using reliability parameters. A tree
diagram is used to graphically and logically order these events, and they are linked
to one another via logical AND or OR operations.
4 A vessel-year represents 1 year of a vessel being in operation. If there are 10 vessels which each
have operated for 1 year, this is equal to 10 vessel-years.
7 Risk Assessment and Management of Chemical Processes
cause failure analysis. More information about these techniques as well as about the
fundamentals of probability can be found in Appendix E.
Fig. 7.6 Illustration of the different approaches that can be used for quantitative probability
analysis of an accident scenario depending on the availability of data
Historical Data
If historical records of an accident scenario are sufficient, accurate, and applicable, they can be used to estimate its frequency of occurrence. Even though these data
quality criteria are often difficult to fulfill, this technique can be applicable at the
early stages of process development when other techniques cannot be applied (see
p. 298 in CCPS (1999)). In this case, the frequency can be calculated by dividing the
number of previous accidents caused by the total number of equipment in operation
over a certain period. Using the example of a reaction vessel, if there have been
10 releases of a certain hazardous substance over a total of 1000 vessel-years, 4 the
estimated release frequency will be 0.01 per vessel-year.
Fault Tree Analysis
Fault tree analysis (FTA) is a failure sequence model that can be used to estimate
the probability of a loss event, known as the top event, that results from a sequence
of earlier events, known as causal events.
A fault tree analysis starts from the top event and then identifies the causal
events deductively. Each of the causal events (k) has an associated probability of
occurrence P k , which are usually estimated using reliability parameters. A tree
diagram is used to graphically and logically order these events, and they are linked
to one another via logical AND or OR operations.
4 A vessel-year represents 1 year of a vessel being in operation. If there are 10 vessels which each
have operated for 1 year, this is equal to 10 vessel-years.