

5.8 Eco-efficiency
97
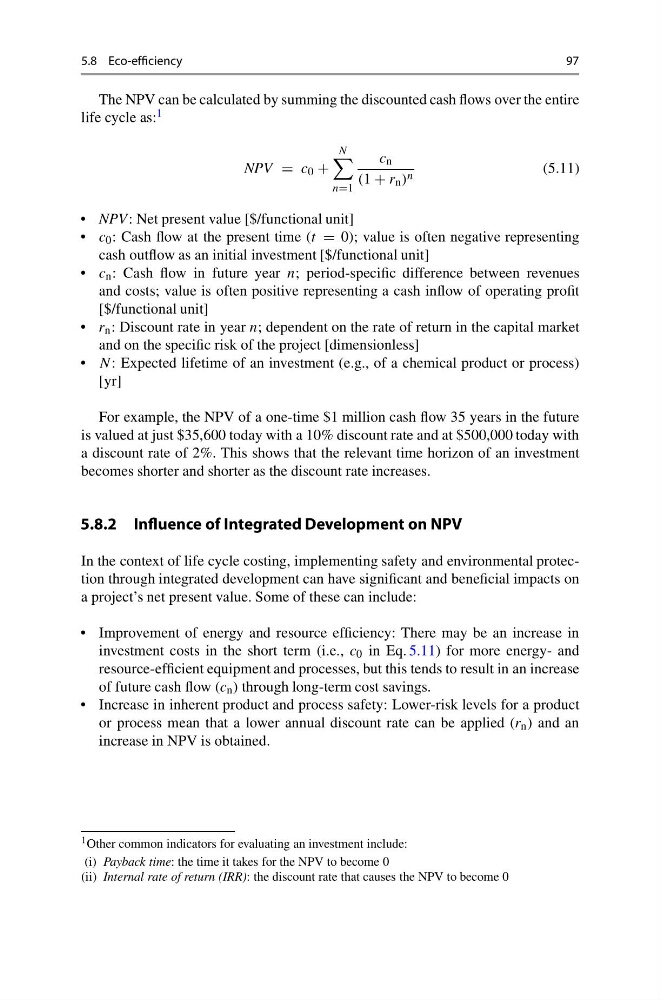
The NPV can be calculated by summing the discounted cash flows over the entire
life cycle as: 1
NPV = c 0 +
N
n=1
c n
(1 + r n ) n
(5.11)
• NPV: Net present value [$/functional unit]
• c 0 : Cash flow at the present time (t = 0); value is often negative representing
cash outflow as an initial investment [$/functional unit]
• c n : Cash flow in future year n; period-specific difference between revenues
and costs; value is often positive representing a cash inflow of operating profit
[$/functional unit]
• r n : Discount rate in year n; dependent on the rate of return in the capital market
and on the specific risk of the project [dimensionless]
• N: Expected lifetime of an investment (e.g., of a chemical product or process)
[yr]
For example, the NPV of a one-time $1 million cash flow 35 years in the future
is valued at just $35,600 today with a 10% discount rate and at $500,000 today with
a discount rate of 2%. This shows that the relevant time horizon of an investment
becomes shorter and shorter as the discount rate increases.
5.8.2 Influence of Integrated Development on NPV
In the context of life cycle costing, implementing safety and environmental protection through integrated development can have significant and beneficial impacts on
a project’s net present value. Some of these can include:
• Improvement of energy and resource efficiency: There may be an increase in
investment costs in the short term (i.e., c 0 in Eq. 5.11) for more energy- and
resource-efficient equipment and processes, but this tends to result in an increase
of future cash flow (c n ) through long-term cost savings.
• Increase in inherent product and process safety: Lower-risk levels for a product
or process mean that a lower annual discount rate can be applied (r n ) and an
increase in NPV is obtained.
1 Other common indicators for evaluating an investment include:
(i) Payback time: the time it takes for the NPV to become 0
(ii) Internal rate of return (IRR): the discount rate that causes the NPV to become 0
97
The NPV can be calculated by summing the discounted cash flows over the entire
life cycle as: 1
NPV = c 0 +
N
n=1
c n
(1 + r n ) n
(5.11)
• NPV: Net present value [$/functional unit]
• c 0 : Cash flow at the present time (t = 0); value is often negative representing
cash outflow as an initial investment [$/functional unit]
• c n : Cash flow in future year n; period-specific difference between revenues
and costs; value is often positive representing a cash inflow of operating profit
[$/functional unit]
• r n : Discount rate in year n; dependent on the rate of return in the capital market
and on the specific risk of the project [dimensionless]
• N: Expected lifetime of an investment (e.g., of a chemical product or process)
[yr]
For example, the NPV of a one-time $1 million cash flow 35 years in the future
is valued at just $35,600 today with a 10% discount rate and at $500,000 today with
a discount rate of 2%. This shows that the relevant time horizon of an investment
becomes shorter and shorter as the discount rate increases.
5.8.2 Influence of Integrated Development on NPV
In the context of life cycle costing, implementing safety and environmental protection through integrated development can have significant and beneficial impacts on
a project’s net present value. Some of these can include:
• Improvement of energy and resource efficiency: There may be an increase in
investment costs in the short term (i.e., c 0 in Eq. 5.11) for more energy- and
resource-efficient equipment and processes, but this tends to result in an increase
of future cash flow (c n ) through long-term cost savings.
• Increase in inherent product and process safety: Lower-risk levels for a product
or process mean that a lower annual discount rate can be applied (r n ) and an
increase in NPV is obtained.
1 Other common indicators for evaluating an investment include:
(i) Payback time: the time it takes for the NPV to become 0
(ii) Internal rate of return (IRR): the discount rate that causes the NPV to become 0