

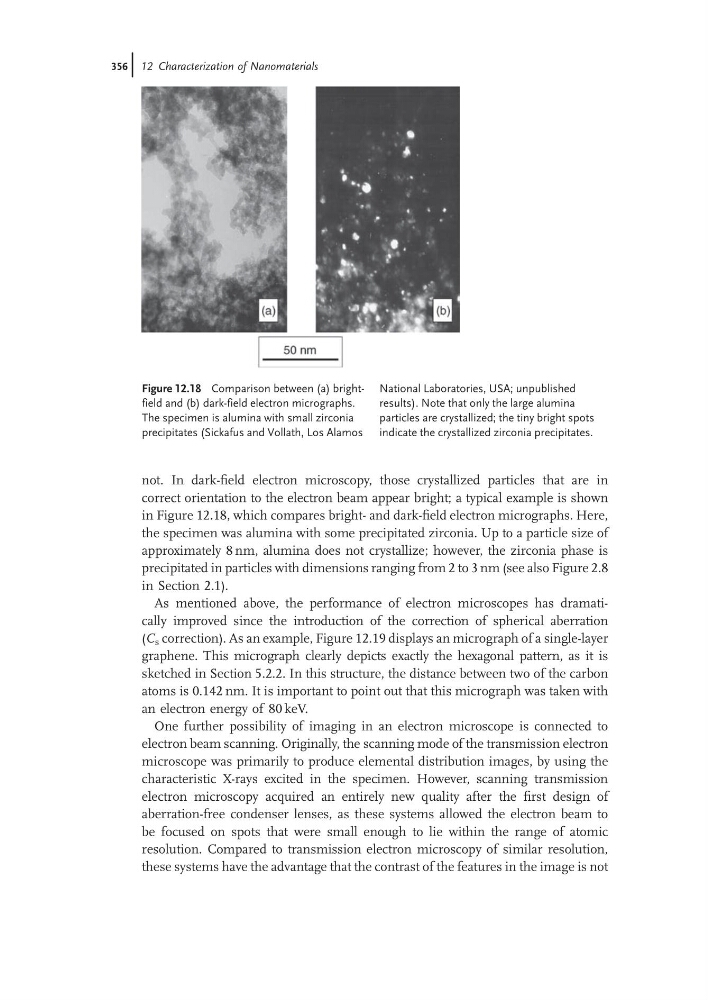
not. In dark-field electron microscopy, those crystallized particles that are in
correct orientation to the electron beam appear bright; a typical example is shown
in Figure 12.18, which compares bright- and dark-field electron micrographs. Here,
the specimen was alumina with some precipitated zirconia. Up to a particle size of
approximately 8 nm, alumina does not crystallize; however, the zirconia phase is
precipitated in particles with dimensions ranging from 2 to 3 nm (see also Figure 2.8
in Section 2.1).
As mentioned above, the performance of electron microscopes has dramatically improved since the introduction of the correction of spherical aberration
(C s correction). As an example, Figure 12.19 displays an micrograph of a single-layer
graphene. This micrograph clearly depicts exactly the hexagonal pattern, as it is
sketched in Section 5.2.2. In this structure, the distance between two of the carbon
atoms is 0.142 nm. It is important to point out that this micrograph was taken with
an electron energy of 80 keV.
One further possibility of imaging in an electron microscope is connected to
electron beam scanning. Originally, the scanning mode of the transmission electron
microscope was primarily to produce elemental distribution images, by using the
characteristic X-rays excited in the specimen. However, scanning transmission
electron microscopy acquired an entirely new quality after the first design of
aberration-free condenser lenses, as these systems allowed the electron beam to
be focused on spots that were small enough to lie within the range of atomic
resolution. Compared to transmission electron microscopy of similar resolution,
these systems have the advantage that the contrast of the features in the image is not
Figure 12.18 Comparison between (a) brightfield and (b) dark-field electron micrographs.
The specimen is alumina with small zirconia
precipitates (Sickafus and Vollath, Los Alamos
National Laboratories, USA; unpublished
results). Note that only the large alumina
particles are crystallized; the tiny bright spots
indicate the crystallized zirconia precipitates.
356j 12 Characterization of Nanomaterials
correct orientation to the electron beam appear bright; a typical example is shown
in Figure 12.18, which compares bright- and dark-field electron micrographs. Here,
the specimen was alumina with some precipitated zirconia. Up to a particle size of
approximately 8 nm, alumina does not crystallize; however, the zirconia phase is
precipitated in particles with dimensions ranging from 2 to 3 nm (see also Figure 2.8
in Section 2.1).
As mentioned above, the performance of electron microscopes has dramatically improved since the introduction of the correction of spherical aberration
(C s correction). As an example, Figure 12.19 displays an micrograph of a single-layer
graphene. This micrograph clearly depicts exactly the hexagonal pattern, as it is
sketched in Section 5.2.2. In this structure, the distance between two of the carbon
atoms is 0.142 nm. It is important to point out that this micrograph was taken with
an electron energy of 80 keV.
One further possibility of imaging in an electron microscope is connected to
electron beam scanning. Originally, the scanning mode of the transmission electron
microscope was primarily to produce elemental distribution images, by using the
characteristic X-rays excited in the specimen. However, scanning transmission
electron microscopy acquired an entirely new quality after the first design of
aberration-free condenser lenses, as these systems allowed the electron beam to
be focused on spots that were small enough to lie within the range of atomic
resolution. Compared to transmission electron microscopy of similar resolution,
these systems have the advantage that the contrast of the features in the image is not
Figure 12.18 Comparison between (a) brightfield and (b) dark-field electron micrographs.
The specimen is alumina with small zirconia
precipitates (Sickafus and Vollath, Los Alamos
National Laboratories, USA; unpublished
results). Note that only the large alumina
particles are crystallized; the tiny bright spots
indicate the crystallized zirconia precipitates.
356j 12 Characterization of Nanomaterials