

In the examples shown in Figures 12.9 and 12.10, the interpretation was not too
difficult. However, the situation is significantly more confusing in the case of
tetragonal–cubic transformations. Owing to the broad diffraction lines, it is often
(perhaps in most cases) not possible to decide unequivocally if the structure is cubic
or tetragonal, or if there is a superposition of the spectra of both structures. As an
example, this problem is faced in the case of zirconia or BaTiO 3 , but a decisive
statement based on diffraction data alone is impossible in such cases. Additional
information that is helpful may be obtained from density measurements or
extended X-ray absorption fine structure (EXAFS) results. A typical example is
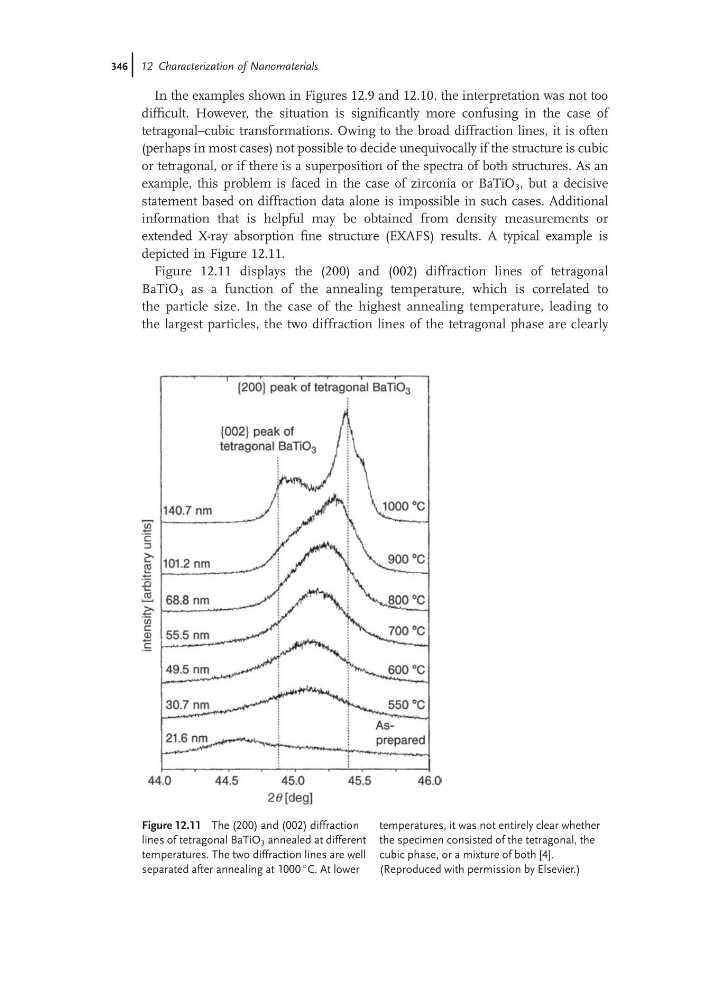
depicted in Figure 12.11.
Figure 12.11 displays the (200) and (002) diffraction lines of tetragonal
BaTiO 3 as a function of the annealing temperature, which is correlated to
the particle size. In the case of the highest annealing temperature, leading to
the largest particles, the two diffraction lines of the tetragonal phase are clearly
Figure 12.11 The (200) and (002) diffraction
lines of tetragonal BaTiO 3 annealed at different
temperatures. The two diffraction lines are well
separated after annealing at 1000
C. At lower
temperatures, it was not entirely clear whether
the specimen consisted of the tetragonal, the
cubic phase, or a mixture of both [4].
(Reproduced with permission by Elsevier.)
346j 12 Characterization of Nanomaterials
difficult. However, the situation is significantly more confusing in the case of
tetragonal–cubic transformations. Owing to the broad diffraction lines, it is often
(perhaps in most cases) not possible to decide unequivocally if the structure is cubic
or tetragonal, or if there is a superposition of the spectra of both structures. As an
example, this problem is faced in the case of zirconia or BaTiO 3 , but a decisive
statement based on diffraction data alone is impossible in such cases. Additional
information that is helpful may be obtained from density measurements or
extended X-ray absorption fine structure (EXAFS) results. A typical example is
depicted in Figure 12.11.
Figure 12.11 displays the (200) and (002) diffraction lines of tetragonal
BaTiO 3 as a function of the annealing temperature, which is correlated to
the particle size. In the case of the highest annealing temperature, leading to
the largest particles, the two diffraction lines of the tetragonal phase are clearly
Figure 12.11 The (200) and (002) diffraction
lines of tetragonal BaTiO 3 annealed at different
temperatures. The two diffraction lines are well
separated after annealing at 1000
C. At lower
temperatures, it was not entirely clear whether
the specimen consisted of the tetragonal, the
cubic phase, or a mixture of both [4].
(Reproduced with permission by Elsevier.)
346j 12 Characterization of Nanomaterials