

most importantly, that Langmuir’s theory is applicable to each layer. Equation (12.8)
displays the series of reactions assumed for the BET process:
M G þ V S ! L 1
M G þ V L1 ! L 2
M G þ V L2 ! L 3
. . .
ð12:8Þ
where V S represents a vacancy of the adsorbed layer at the surface and V Li represents
a vacancy in the ith layer L i of adsorbed molecules. The situation represented by the
reaction in Eq. (12.8) is shown in Figure 12.3.
After some mathematical manipulation, the BET isotherm is given by:
H ¼
c
p
p 0
1 À
p
p 0
1 À 1 À c
ð
Þ
p
p 0
!
ð12:9Þ
(For details of the lengthy derivation of this formula, please consult a textbook on
physical chemistry.) Figure 12.4 shows the coverage H as a function of the ratio p/p 0
for different values of the BET constant c.
Figure 12.3 Assumption of Brunauer et al. [1] about the adsorbed layers at a surface. Basically,
these authors assumed a multilayer system, without the need to form completely filled layers.
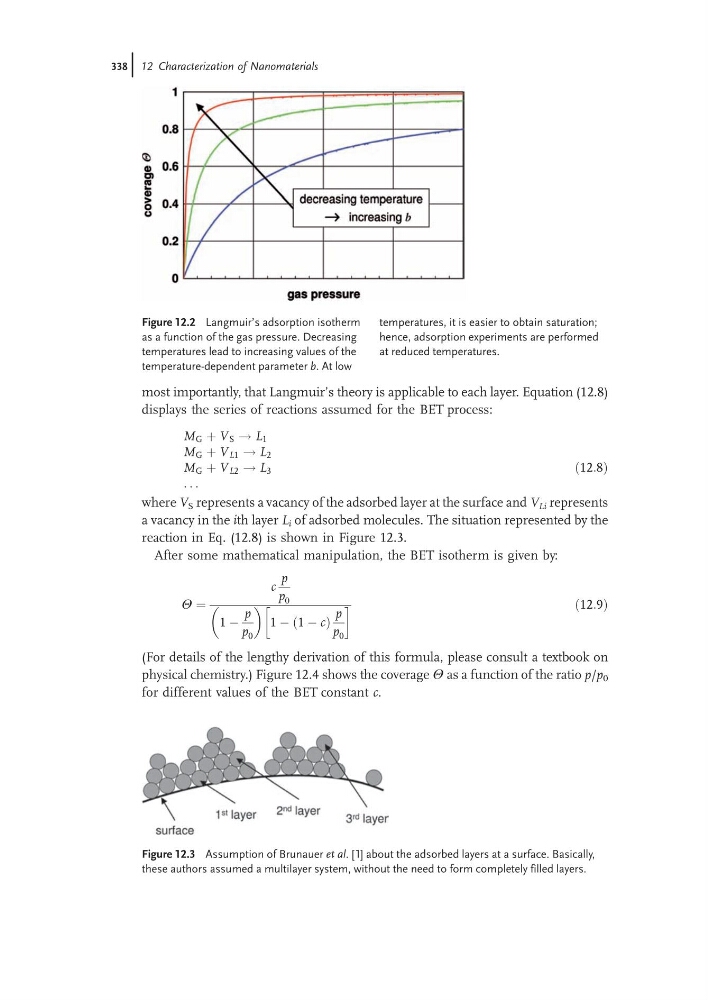
Figure 12.2 Langmuir’s adsorption isotherm
as a function of the gas pressure. Decreasing
temperatures lead to increasing values of the
temperature-dependent parameter b. At low
temperatures, it is easier to obtain saturation;
hence, adsorption experiments are performed
at reduced temperatures.
338j 12 Characterization of Nanomaterials
displays the series of reactions assumed for the BET process:
M G þ V S ! L 1
M G þ V L1 ! L 2
M G þ V L2 ! L 3
. . .
ð12:8Þ
where V S represents a vacancy of the adsorbed layer at the surface and V Li represents
a vacancy in the ith layer L i of adsorbed molecules. The situation represented by the
reaction in Eq. (12.8) is shown in Figure 12.3.
After some mathematical manipulation, the BET isotherm is given by:
H ¼
c
p
p 0
1 À
p
p 0
1 À 1 À c
ð
Þ
p
p 0
!
ð12:9Þ
(For details of the lengthy derivation of this formula, please consult a textbook on
physical chemistry.) Figure 12.4 shows the coverage H as a function of the ratio p/p 0
for different values of the BET constant c.
Figure 12.3 Assumption of Brunauer et al. [1] about the adsorbed layers at a surface. Basically,
these authors assumed a multilayer system, without the need to form completely filled layers.
Figure 12.2 Langmuir’s adsorption isotherm
as a function of the gas pressure. Decreasing
temperatures lead to increasing values of the
temperature-dependent parameter b. At low
temperatures, it is easier to obtain saturation;
hence, adsorption experiments are performed
at reduced temperatures.
338j 12 Characterization of Nanomaterials