

show clearly that all of the plots are equally good or poor, with Figure 11.19c being
the most interesting in this context. Here, fit 1 uses all of the data points, but is worse
compared to the fits in Figure 11.19a and b. However, the fit is perfect when the
experimental point relating to the largest grain size is omitted; clearly, this point is
outside of the size range where the Ashby–Verall mechanism acts.
With decreasing grain size, the influence of the deformation rate becomes
dominant, and this has been experimentally very well proven and described by
many theoretical models. As examples of the results of extensive model calculations,
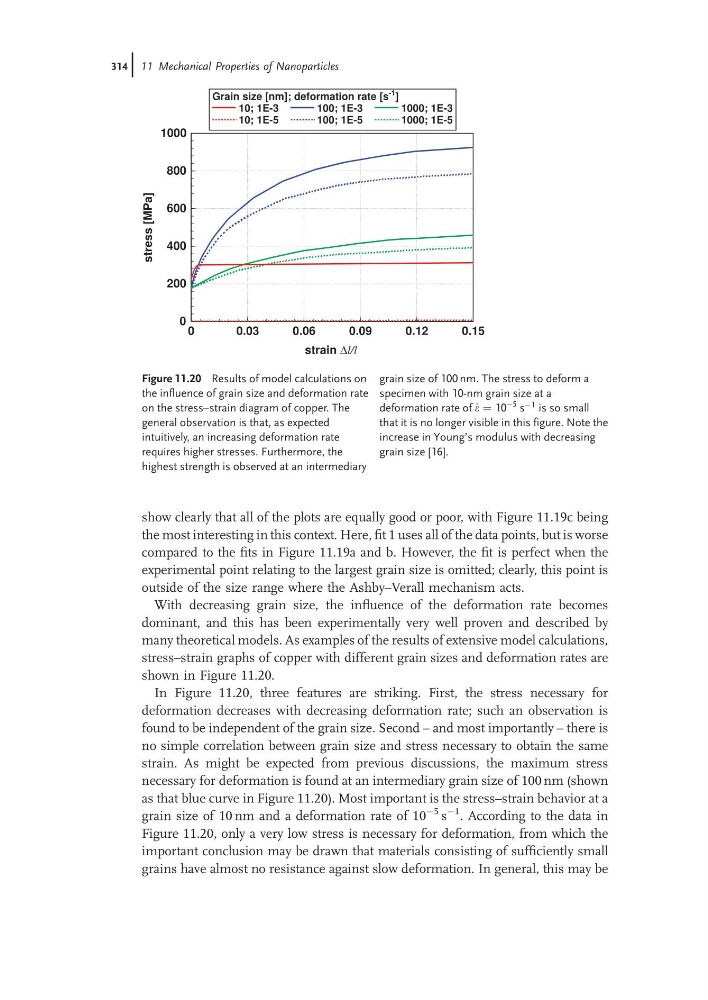
stress–strain graphs of copper with different grain sizes and deformation rates are
shown in Figure 11.20.
In Figure 11.20, three features are striking. First, the stress necessary for
deformation decreases with decreasing deformation rate; such an observation is
found to be independent of the grain size. Second – and most importantly – there is
no simple correlation between grain size and stress necessary to obtain the same
strain. As might be expected from previous discussions, the maximum stress
necessary for deformation is found at an intermediary grain size of 100 nm (shown
as that blue curve in Figure 11.20). Most important is the stress–strain behavior at a
grain size of 10 nm and a deformation rate of 10
À5 s
À1 . According to the data in
Figure 11.20, only a very low stress is necessary for deformation, from which the
important conclusion may be drawn that materials consisting of sufficiently small
grains have almost no resistance against slow deformation. In general, this may be
0
0.03
0.06
0.09
0.12
0.15
0
200
400
600
800
1000
Grain size [nm]; deformation rate [s
-1 ]
10; 1E-3
10; 1E-5
100; 1E-3
100; 1E-5
1000; 1E-3
1000; 1E-5
stress [MPa]
strain Δl/l
Figure 11.20 Results of model calculations on
the influence of grain size and deformation rate
on the stress–strain diagram of copper. The
general observation is that, as expected
intuitively, an increasing deformation rate
requires higher stresses. Furthermore, the
highest strength is observed at an intermediary
grain size of 100 nm. The stress to deform a
specimen with 10-nm grain size at a
deformation rate of _
e ¼ 10
À5 s
À1 is so small
that it is no longer visible in this figure. Note the
increase in Young’s modulus with decreasing
grain size [16].
314j 11 Mechanical Properties of Nanoparticles
the most interesting in this context. Here, fit 1 uses all of the data points, but is worse
compared to the fits in Figure 11.19a and b. However, the fit is perfect when the
experimental point relating to the largest grain size is omitted; clearly, this point is
outside of the size range where the Ashby–Verall mechanism acts.
With decreasing grain size, the influence of the deformation rate becomes
dominant, and this has been experimentally very well proven and described by
many theoretical models. As examples of the results of extensive model calculations,
stress–strain graphs of copper with different grain sizes and deformation rates are
shown in Figure 11.20.
In Figure 11.20, three features are striking. First, the stress necessary for
deformation decreases with decreasing deformation rate; such an observation is
found to be independent of the grain size. Second – and most importantly – there is
no simple correlation between grain size and stress necessary to obtain the same
strain. As might be expected from previous discussions, the maximum stress
necessary for deformation is found at an intermediary grain size of 100 nm (shown
as that blue curve in Figure 11.20). Most important is the stress–strain behavior at a
grain size of 10 nm and a deformation rate of 10
À5 s
À1 . According to the data in
Figure 11.20, only a very low stress is necessary for deformation, from which the
important conclusion may be drawn that materials consisting of sufficiently small
grains have almost no resistance against slow deformation. In general, this may be
0
0.03
0.06
0.09
0.12
0.15
0
200
400
600
800
1000
Grain size [nm]; deformation rate [s
-1 ]
10; 1E-3
10; 1E-5
100; 1E-3
100; 1E-5
1000; 1E-3
1000; 1E-5
stress [MPa]
strain Δl/l
Figure 11.20 Results of model calculations on
the influence of grain size and deformation rate
on the stress–strain diagram of copper. The
general observation is that, as expected
intuitively, an increasing deformation rate
requires higher stresses. Furthermore, the
highest strength is observed at an intermediary
grain size of 100 nm. The stress to deform a
specimen with 10-nm grain size at a
deformation rate of _
e ¼ 10
À5 s
À1 is so small
that it is no longer visible in this figure. Note the
increase in Young’s modulus with decreasing
grain size [16].
314j 11 Mechanical Properties of Nanoparticles