

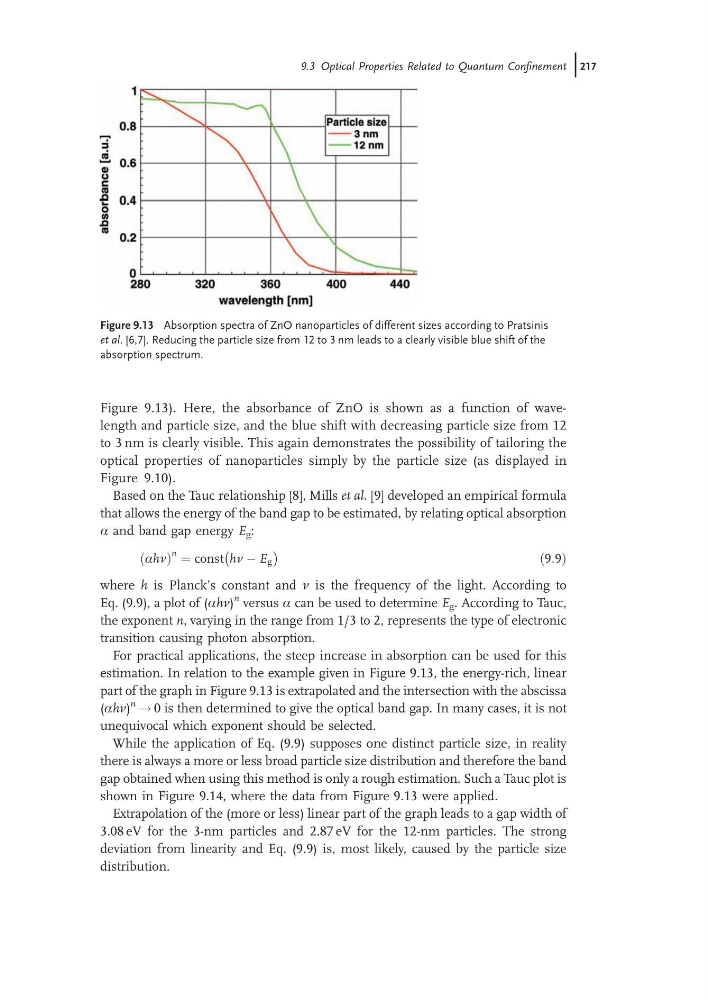
Figure 9.13). Here, the absorbance of ZnO is shown as a function of wavelength and particle size, and the blue shift with decreasing particle size from 12
to 3 nm is clearly visible. This again demonstrates the possibility of tailoring the
optical properties of nanoparticles simply by the particle size (as displayed in
Figure 9.10).
Based on the Tauc relationship [8], Mills et al. [9] developed an empirical formula
that allows the energy of the band gap to be estimated, by relating optical absorption
a and band gap energy E g :
ahn
ð
Þ
n ¼ const hn À E g
À
Á
ð9:9Þ
where h is Planck’s constant and n is the frequency of the light. According to
Eq. (9.9), a plot of (ahn)
n versus a can be used to determine E g . According to Tauc,
the exponent n, varying in the range from 1/3 to 2, represents the type of electronic
transition causing photon absorption.
For practical applications, the steep increase in absorption can be used for this
estimation. In relation to the example given in Figure 9.13, the energy-rich, linear
part of the graph in Figure 9.13 is extrapolated and the intersection with the abscissa
(ahn)
n ! 0 is then determined to give the optical band gap. In many cases, it is not
unequivocal which exponent should be selected.
While the application of Eq. (9.9) supposes one distinct particle size, in reality
there is always a more or less broad particle size distribution and therefore the band
gap obtained when using this method is only a rough estimation. Such a Tauc plot is
shown in Figure 9.14, where the data from Figure 9.13 were applied.
Extrapolation of the (more or less) linear part of the graph leads to a gap width of
3.08 eV for the 3-nm particles and 2.87 eV for the 12-nm particles. The strong
deviation from linearity and Eq. (9.9) is, most likely, caused by the particle size
distribution.
Figure 9.13 Absorption spectra of ZnO nanoparticles of different sizes according to Pratsinis
et al. [6,7]. Reducing the particle size from 12 to 3 nm leads to a clearly visible blue shift of the
absorption spectrum.
9.3 Optical Properties Related to Quantum Confinement j217
to 3 nm is clearly visible. This again demonstrates the possibility of tailoring the
optical properties of nanoparticles simply by the particle size (as displayed in
Figure 9.10).
Based on the Tauc relationship [8], Mills et al. [9] developed an empirical formula
that allows the energy of the band gap to be estimated, by relating optical absorption
a and band gap energy E g :
ahn
ð
Þ
n ¼ const hn À E g
À
Á
ð9:9Þ
where h is Planck’s constant and n is the frequency of the light. According to
Eq. (9.9), a plot of (ahn)
n versus a can be used to determine E g . According to Tauc,
the exponent n, varying in the range from 1/3 to 2, represents the type of electronic
transition causing photon absorption.
For practical applications, the steep increase in absorption can be used for this
estimation. In relation to the example given in Figure 9.13, the energy-rich, linear
part of the graph in Figure 9.13 is extrapolated and the intersection with the abscissa
(ahn)
n ! 0 is then determined to give the optical band gap. In many cases, it is not
unequivocal which exponent should be selected.
While the application of Eq. (9.9) supposes one distinct particle size, in reality
there is always a more or less broad particle size distribution and therefore the band
gap obtained when using this method is only a rough estimation. Such a Tauc plot is
shown in Figure 9.14, where the data from Figure 9.13 were applied.
Extrapolation of the (more or less) linear part of the graph leads to a gap width of
3.08 eV for the 3-nm particles and 2.87 eV for the 12-nm particles. The strong
deviation from linearity and Eq. (9.9) is, most likely, caused by the particle size
distribution.
Figure 9.13 Absorption spectra of ZnO nanoparticles of different sizes according to Pratsinis
et al. [6,7]. Reducing the particle size from 12 to 3 nm leads to a clearly visible blue shift of the
absorption spectrum.
9.3 Optical Properties Related to Quantum Confinement j217