

The influence of particle size is found not only in the band gap but, therefore, in
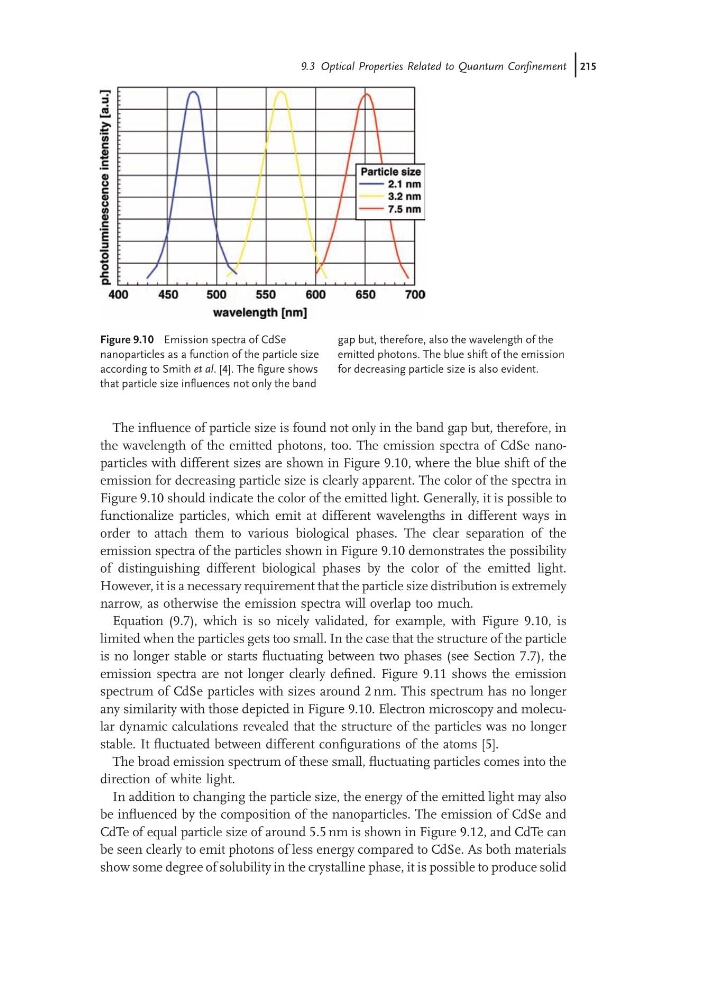
the wavelength of the emitted photons, too. The emission spectra of CdSe nanoparticles with different sizes are shown in Figure 9.10, where the blue shift of the
emission for decreasing particle size is clearly apparent. The color of the spectra in
Figure 9.10 should indicate the color of the emitted light. Generally, it is possible to
functionalize particles, which emit at different wavelengths in different ways in
order to attach them to various biological phases. The clear separation of the
emission spectra of the particles shown in Figure 9.10 demonstrates the possibility
of distinguishing different biological phases by the color of the emitted light.
However, it is a necessary requirement that the particle size distribution is extremely
narrow, as otherwise the emission spectra will overlap too much.
Equation (9.7), which is so nicely validated, for example, with Figure 9.10, is
limited when the particles gets too small. In the case that the structure of the particle
is no longer stable or starts fluctuating between two phases (see Section 7.7), the
emission spectra are not longer clearly defined. Figure 9.11 shows the emission
spectrum of CdSe particles with sizes around 2 nm. This spectrum has no longer
any similarity with those depicted in Figure 9.10. Electron microscopy and molecular dynamic calculations revealed that the structure of the particles was no longer
stable. It fluctuated between different configurations of the atoms [5].
The broad emission spectrum of these small, fluctuating particles comes into the
direction of white light.
In addition to changing the particle size, the energy of the emitted light may also
be influenced by the composition of the nanoparticles. The emission of CdSe and
CdTe of equal particle size of around 5.5 nm is shown in Figure 9.12, and CdTe can
be seen clearly to emit photons of less energy compared to CdSe. As both materials
show some degree of solubility in the crystalline phase, it is possible to produce solid
Figure 9.10 Emission spectra of CdSe
nanoparticles as a function of the particle size
according to Smith et al. [4]. The figure shows
that particle size influences not only the band
gap but, therefore, also the wavelength of the
emitted photons. The blue shift of the emission
for decreasing particle size is also evident.
9.3 Optical Properties Related to Quantum Confinement j215
the wavelength of the emitted photons, too. The emission spectra of CdSe nanoparticles with different sizes are shown in Figure 9.10, where the blue shift of the
emission for decreasing particle size is clearly apparent. The color of the spectra in
Figure 9.10 should indicate the color of the emitted light. Generally, it is possible to
functionalize particles, which emit at different wavelengths in different ways in
order to attach them to various biological phases. The clear separation of the
emission spectra of the particles shown in Figure 9.10 demonstrates the possibility
of distinguishing different biological phases by the color of the emitted light.
However, it is a necessary requirement that the particle size distribution is extremely
narrow, as otherwise the emission spectra will overlap too much.
Equation (9.7), which is so nicely validated, for example, with Figure 9.10, is
limited when the particles gets too small. In the case that the structure of the particle
is no longer stable or starts fluctuating between two phases (see Section 7.7), the
emission spectra are not longer clearly defined. Figure 9.11 shows the emission
spectrum of CdSe particles with sizes around 2 nm. This spectrum has no longer
any similarity with those depicted in Figure 9.10. Electron microscopy and molecular dynamic calculations revealed that the structure of the particles was no longer
stable. It fluctuated between different configurations of the atoms [5].
The broad emission spectrum of these small, fluctuating particles comes into the
direction of white light.
In addition to changing the particle size, the energy of the emitted light may also
be influenced by the composition of the nanoparticles. The emission of CdSe and
CdTe of equal particle size of around 5.5 nm is shown in Figure 9.12, and CdTe can
be seen clearly to emit photons of less energy compared to CdSe. As both materials
show some degree of solubility in the crystalline phase, it is possible to produce solid
Figure 9.10 Emission spectra of CdSe
nanoparticles as a function of the particle size
according to Smith et al. [4]. The figure shows
that particle size influences not only the band
gap but, therefore, also the wavelength of the
emitted photons. The blue shift of the emission
for decreasing particle size is also evident.
9.3 Optical Properties Related to Quantum Confinement j215