

of calculations for the course of the concentrations as function of the temperature. It is
important to realize that in the adiabatic case, one always has to distinguish between the
heating and the cooling case. Looking at the case of local enclosure, depicted in
Figure 7.28a, one realizes a broad range of bistability. In general, ranges like the one
with positive slope values are experimentally not accessible; hence, the vertical tangents
limit the temperature range of bistability (range 2). The concentration ranges between
0.5
0.6
0.7
0.8
0.9
1
1.1
1.2
1.3
reduced temperature T/T melt
diffraction
line
intensity
[a.u.]
Heating cycle
Cooling cycle
melting
solidifying
solid phase
liquid phase
(a)
200
400
600
800
1000
temperature [K]
diffraction
line
intensity
[a.u.]
Heating cycle
Cooling cycle
Solid phase
Liquid phase
(b)
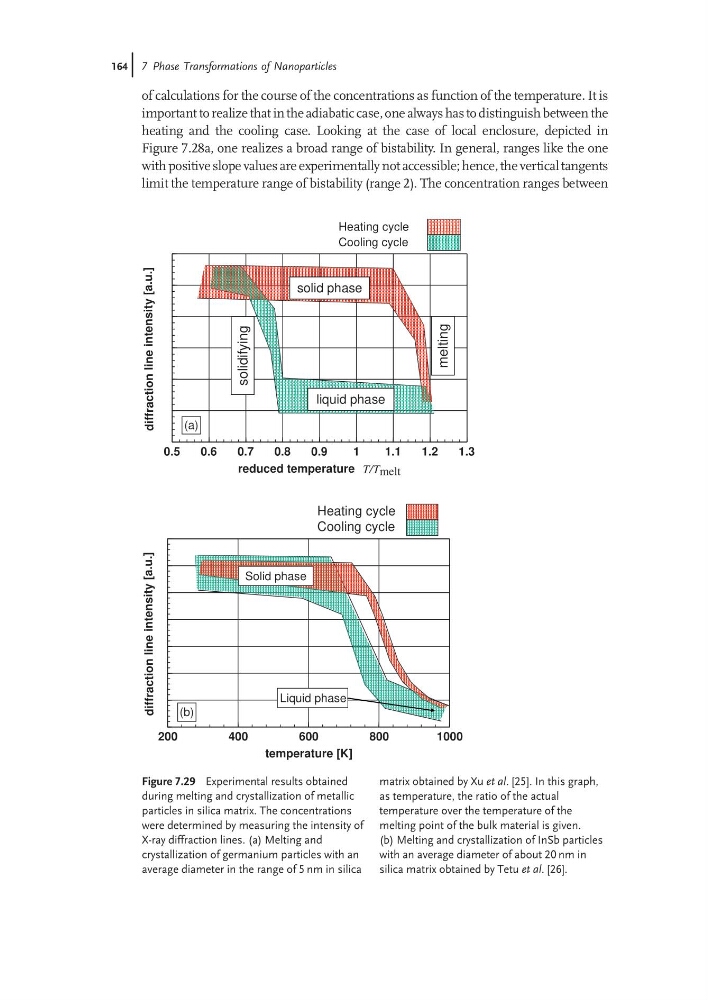
Figure 7.29 Experimental results obtained
during melting and crystallization of metallic
particles in silica matrix. The concentrations
were determined by measuring the intensity of
X-ray diffraction lines. (a) Melting and
crystallization of germanium particles with an
average diameter in the range of 5 nm in silica
matrix obtained by Xu et al. [25]. In this graph,
as temperature, the ratio of the actual
temperature over the temperature of the
melting point of the bulk material is given.
(b) Melting and crystallization of InSb particles
with an average diameter of about 20 nm in
silica matrix obtained by Tetu et al. [26].
164j 7 Phase Transformations of Nanoparticles
important to realize that in the adiabatic case, one always has to distinguish between the
heating and the cooling case. Looking at the case of local enclosure, depicted in
Figure 7.28a, one realizes a broad range of bistability. In general, ranges like the one
with positive slope values are experimentally not accessible; hence, the vertical tangents
limit the temperature range of bistability (range 2). The concentration ranges between
0.5
0.6
0.7
0.8
0.9
1
1.1
1.2
1.3
reduced temperature T/T melt
diffraction
line
intensity
[a.u.]
Heating cycle
Cooling cycle
melting
solidifying
solid phase
liquid phase
(a)
200
400
600
800
1000
temperature [K]
diffraction
line
intensity
[a.u.]
Heating cycle
Cooling cycle
Solid phase
Liquid phase
(b)
Figure 7.29 Experimental results obtained
during melting and crystallization of metallic
particles in silica matrix. The concentrations
were determined by measuring the intensity of
X-ray diffraction lines. (a) Melting and
crystallization of germanium particles with an
average diameter in the range of 5 nm in silica
matrix obtained by Xu et al. [25]. In this graph,
as temperature, the ratio of the actual
temperature over the temperature of the
melting point of the bulk material is given.
(b) Melting and crystallization of InSb particles
with an average diameter of about 20 nm in
silica matrix obtained by Tetu et al. [26].
164j 7 Phase Transformations of Nanoparticles