

interaction with the surrounding gaseous atmosphere and the kinetic processes of
melting. Coombes [12] suggested that melting started in a surface layer which was
estimated to have a thickness of about 3 nm; therefore, it was not surprising that the
linear approximation fitted up to approximately 1/d ¼ 0.145 nm
À1 , corresponding a
particle diameter of approximately 7 nm.
By replacing surface energy with the solid–liquid interface energy, the Thomson
equation explains, in a simple manner, the supercooling of liquids without nuclei
for crystallization, as in order to form the first crystal nuclei (homogenous
nucleation) the temperature of the melt must be reduced to a level where the
smallest nuclei are formed.
When considering the crystallization of metal nanoparticles, the phase transformation (where the largest pool of experimental data exists) for most examples
produces b values of less than 1 (see Eq. (7.10)). If b is less than 1, the freezing point
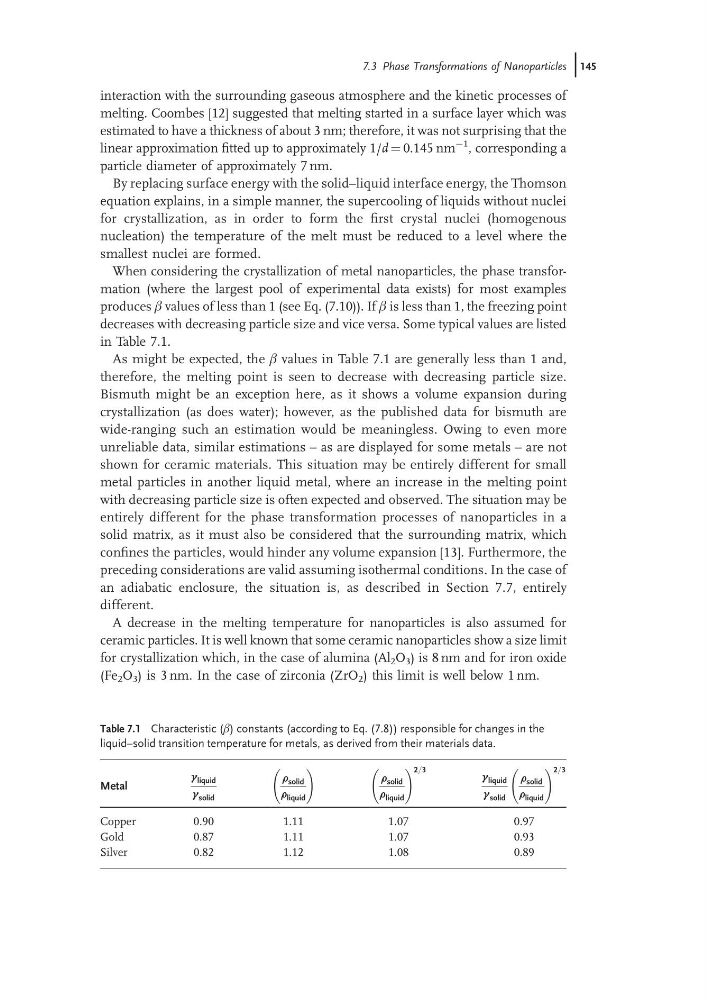
decreases with decreasing particle size and vice versa. Some typical values are listed
in Table 7.1.
As might be expected, the b values in Table 7.1 are generally less than 1 and,
therefore, the melting point is seen to decrease with decreasing particle size.
Bismuth might be an exception here, as it shows a volume expansion during
crystallization (as does water); however, as the published data for bismuth are
wide-ranging such an estimation would be meaningless. Owing to even more
unreliable data, similar estimations – as are displayed for some metals – are not
shown for ceramic materials. This situation may be entirely different for small
metal particles in another liquid metal, where an increase in the melting point
with decreasing particle size is often expected and observed. The situation may be
entirely different for the phase transformation processes of nanoparticles in a
solid matrix, as it must also be considered that the surrounding matrix, which
confines the particles, would hinder any volume expansion [13]. Furthermore, the
preceding considerations are valid assuming isothermal conditions. In the case of
an adiabatic enclosure, the situation is, as described in Section 7.7, entirely
different.
A decrease in the melting temperature for nanoparticles is also assumed for
ceramic particles. It is well known that some ceramic nanoparticles show a size limit
for crystallization which, in the case of alumina (Al 2 O 3 ) is 8 nm and for iron oxide
(Fe 2 O 3 ) is 3 nm. In the case of zirconia (ZrO 2 ) this limit is well below 1 nm.
Table 7.1 Characteristic (b) constants (according to Eq. (7.8)) responsible for changes in the
liquid–solid transition temperature for metals, as derived from their materials data.
Metal
g liquid
g solid
r solid
r liquid
!
r solid
r liquid
! 2=3
g liquid
g solid
r solid
r liquid
! 2=3
Copper
0.90
1.11
1.07
0.97
Gold
0.87
1.11
1.07
0.93
Silver
0.82
1.12
1.08
0.89
7.3 Phase Transformations of Nanoparticles j145
melting. Coombes [12] suggested that melting started in a surface layer which was
estimated to have a thickness of about 3 nm; therefore, it was not surprising that the
linear approximation fitted up to approximately 1/d ¼ 0.145 nm
À1 , corresponding a
particle diameter of approximately 7 nm.
By replacing surface energy with the solid–liquid interface energy, the Thomson
equation explains, in a simple manner, the supercooling of liquids without nuclei
for crystallization, as in order to form the first crystal nuclei (homogenous
nucleation) the temperature of the melt must be reduced to a level where the
smallest nuclei are formed.
When considering the crystallization of metal nanoparticles, the phase transformation (where the largest pool of experimental data exists) for most examples
produces b values of less than 1 (see Eq. (7.10)). If b is less than 1, the freezing point
decreases with decreasing particle size and vice versa. Some typical values are listed
in Table 7.1.
As might be expected, the b values in Table 7.1 are generally less than 1 and,
therefore, the melting point is seen to decrease with decreasing particle size.
Bismuth might be an exception here, as it shows a volume expansion during
crystallization (as does water); however, as the published data for bismuth are
wide-ranging such an estimation would be meaningless. Owing to even more
unreliable data, similar estimations – as are displayed for some metals – are not
shown for ceramic materials. This situation may be entirely different for small
metal particles in another liquid metal, where an increase in the melting point
with decreasing particle size is often expected and observed. The situation may be
entirely different for the phase transformation processes of nanoparticles in a
solid matrix, as it must also be considered that the surrounding matrix, which
confines the particles, would hinder any volume expansion [13]. Furthermore, the
preceding considerations are valid assuming isothermal conditions. In the case of
an adiabatic enclosure, the situation is, as described in Section 7.7, entirely
different.
A decrease in the melting temperature for nanoparticles is also assumed for
ceramic particles. It is well known that some ceramic nanoparticles show a size limit
for crystallization which, in the case of alumina (Al 2 O 3 ) is 8 nm and for iron oxide
(Fe 2 O 3 ) is 3 nm. In the case of zirconia (ZrO 2 ) this limit is well below 1 nm.
Table 7.1 Characteristic (b) constants (according to Eq. (7.8)) responsible for changes in the
liquid–solid transition temperature for metals, as derived from their materials data.
Metal
g liquid
g solid
r solid
r liquid
!
r solid
r liquid
! 2=3
g liquid
g solid
r solid
r liquid
! 2=3
Copper
0.90
1.11
1.07
0.97
Gold
0.87
1.11
1.07
0.93
Silver
0.82
1.12
1.08
0.89
7.3 Phase Transformations of Nanoparticles j145