

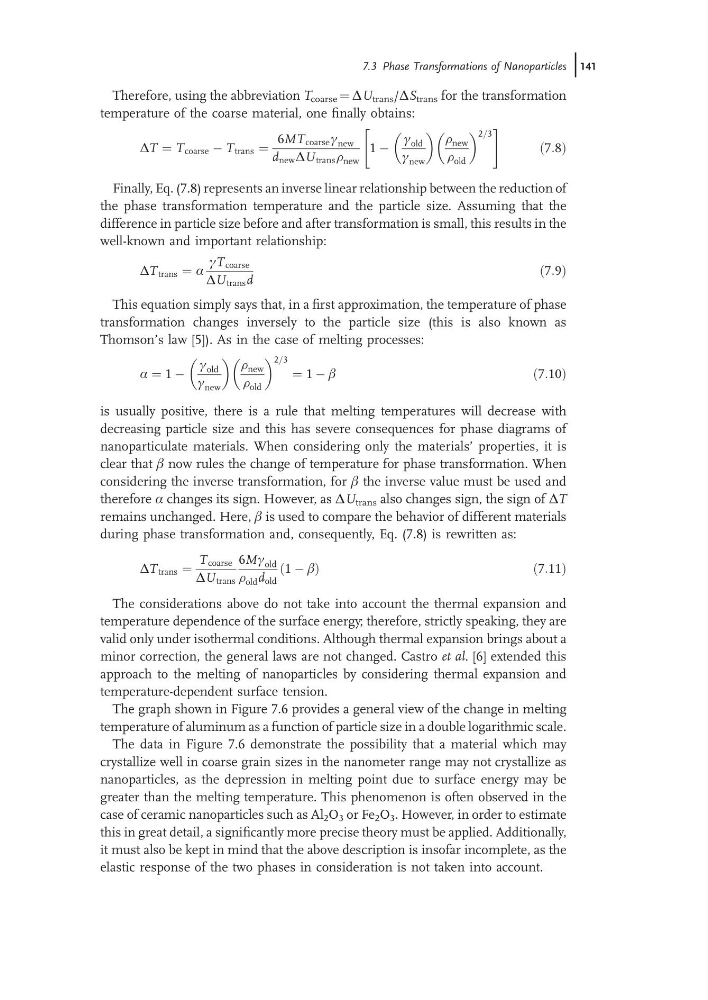
Therefore, using the abbreviation T coarse ¼ DU trans /DS trans for the transformation
temperature of the coarse material, one finally obtains:
DT ¼ T coarse À T trans ¼
6MT coarse c new
d new DU trans r new
1 À
c old
c new
r new
r old
2=3
"
#
ð7:8Þ
Finally, Eq. (7.8) represents an inverse linear relationship between the reduction of
the phase transformation temperature and the particle size. Assuming that the
difference in particle size before and after transformation is small, this results in the
well-known and important relationship:
DT trans ¼ a
cT coarse
DU trans d
ð7:9Þ
This equation simply says that, in a first approximation, the temperature of phase
transformation changes inversely to the particle size (this is also known as
Thomson’s law [5]). As in the case of melting processes:
a ¼ 1 À
c old
c new
r new
r old
2=3
¼ 1 À b
ð7:10Þ
is usually positive, there is a rule that melting temperatures will decrease with
decreasing particle size and this has severe consequences for phase diagrams of
nanoparticulate materials. When considering only the materials’ properties, it is
clear that b now rules the change of temperature for phase transformation. When
considering the inverse transformation, for b the inverse value must be used and
therefore a changes its sign. However, as DU trans also changes sign, the sign of DT
remains unchanged. Here, b is used to compare the behavior of different materials
during phase transformation and, consequently, Eq. (7.8) is rewritten as:
DT trans ¼
T coarse
DU trans
6Mc old
r old d old
1 À b
ð
Þ
ð7:11Þ
The considerations above do not take into account the thermal expansion and
temperature dependence of the surface energy; therefore, strictly speaking, they are
valid only under isothermal conditions. Although thermal expansion brings about a
minor correction, the general laws are not changed. Castro et al. [6] extended this
approach to the melting of nanoparticles by considering thermal expansion and
temperature-dependent surface tension.
The graph shown in Figure 7.6 provides a general view of the change in melting
temperature of aluminum as a function of particle size in a double logarithmic scale.
The data in Figure 7.6 demonstrate the possibility that a material which may
crystallize well in coarse grain sizes in the nanometer range may not crystallize as
nanoparticles, as the depression in melting point due to surface energy may be
greater than the melting temperature. This phenomenon is often observed in the
case of ceramic nanoparticles such as Al 2 O 3 or Fe 2 O 3 . However, in order to estimate
this in great detail, a significantly more precise theory must be applied. Additionally,
it must also be kept in mind that the above description is insofar incomplete, as the
elastic response of the two phases in consideration is not taken into account.
7.3 Phase Transformations of Nanoparticles j141
temperature of the coarse material, one finally obtains:
DT ¼ T coarse À T trans ¼
6MT coarse c new
d new DU trans r new
1 À
c old
c new
r new
r old
2=3
"
#
ð7:8Þ
Finally, Eq. (7.8) represents an inverse linear relationship between the reduction of
the phase transformation temperature and the particle size. Assuming that the
difference in particle size before and after transformation is small, this results in the
well-known and important relationship:
DT trans ¼ a
cT coarse
DU trans d
ð7:9Þ
This equation simply says that, in a first approximation, the temperature of phase
transformation changes inversely to the particle size (this is also known as
Thomson’s law [5]). As in the case of melting processes:
a ¼ 1 À
c old
c new
r new
r old
2=3
¼ 1 À b
ð7:10Þ
is usually positive, there is a rule that melting temperatures will decrease with
decreasing particle size and this has severe consequences for phase diagrams of
nanoparticulate materials. When considering only the materials’ properties, it is
clear that b now rules the change of temperature for phase transformation. When
considering the inverse transformation, for b the inverse value must be used and
therefore a changes its sign. However, as DU trans also changes sign, the sign of DT
remains unchanged. Here, b is used to compare the behavior of different materials
during phase transformation and, consequently, Eq. (7.8) is rewritten as:
DT trans ¼
T coarse
DU trans
6Mc old
r old d old
1 À b
ð
Þ
ð7:11Þ
The considerations above do not take into account the thermal expansion and
temperature dependence of the surface energy; therefore, strictly speaking, they are
valid only under isothermal conditions. Although thermal expansion brings about a
minor correction, the general laws are not changed. Castro et al. [6] extended this
approach to the melting of nanoparticles by considering thermal expansion and
temperature-dependent surface tension.
The graph shown in Figure 7.6 provides a general view of the change in melting
temperature of aluminum as a function of particle size in a double logarithmic scale.
The data in Figure 7.6 demonstrate the possibility that a material which may
crystallize well in coarse grain sizes in the nanometer range may not crystallize as
nanoparticles, as the depression in melting point due to surface energy may be
greater than the melting temperature. This phenomenon is often observed in the
case of ceramic nanoparticles such as Al 2 O 3 or Fe 2 O 3 . However, in order to estimate
this in great detail, a significantly more precise theory must be applied. Additionally,
it must also be kept in mind that the above description is insofar incomplete, as the
elastic response of the two phases in consideration is not taken into account.
7.3 Phase Transformations of Nanoparticles j141