

is known to have a large volume fraction of grain boundaries such an increased
heat capacity would not be too surprising. Additionally, nanomaterials have an
increased tendency to dissolve light-element impurities that, with their larger
degrees of freedom for vibration, contribute significantly to the heat capacity;
this was demonstrated by Tsch€ ope and Birringer for nanocrystalline platinum
[2]. (In this chapter, generally the heat capacity at a constant pressure, C p , is
used; as in a solid material the difference in heat capacity at constant pressure
and constant volume, C V , is negligible.)
An increased heat capacity of nanocrystalline materials is not only found in
metals, comparable phenomena having also been observed in ceramic materials. As
an example, the heat capacity of sintered alumina with a grain size of 20 nm,
compared to a coarse-grained material, is shown in Figure 7.5. In both the cases, the
material consisted of a-phase material, while a small content (about 1%) of c-phase
in the nanocrystalline sample was assumed to have no influence. In Figure 7.5, an
increased heat capacity can be seen at low temperature and, even more strikingly, at
temperatures above 250 K. The authors explained this behavior by there being an
increased freedom for vibration of the ions at the grain boundaries and stressed the
fact that the material had a reduced density of 89%, most likely due to the grain
boundaries. Although the width of grain boundaries is normally assumed to be in
the range of 1 nm, even for a width of 2 nm a reduced grain density must be
assumed. This explains the increased number of vibration modes and, consequently,
the higher heat capacity.
A reduced density – or more generally, a reduced degree of order – appears to be
a general phenomenon that is associated with very small nanoparticles. Its
connection with phase transformations of nanoparticles is discussed in the
following section.
0
5
10
15
20
25
30
35
40
particle diameter [nm]
75
80
85
90
95
heat
capacity C v
[Jmol
-1 K
-1 ]
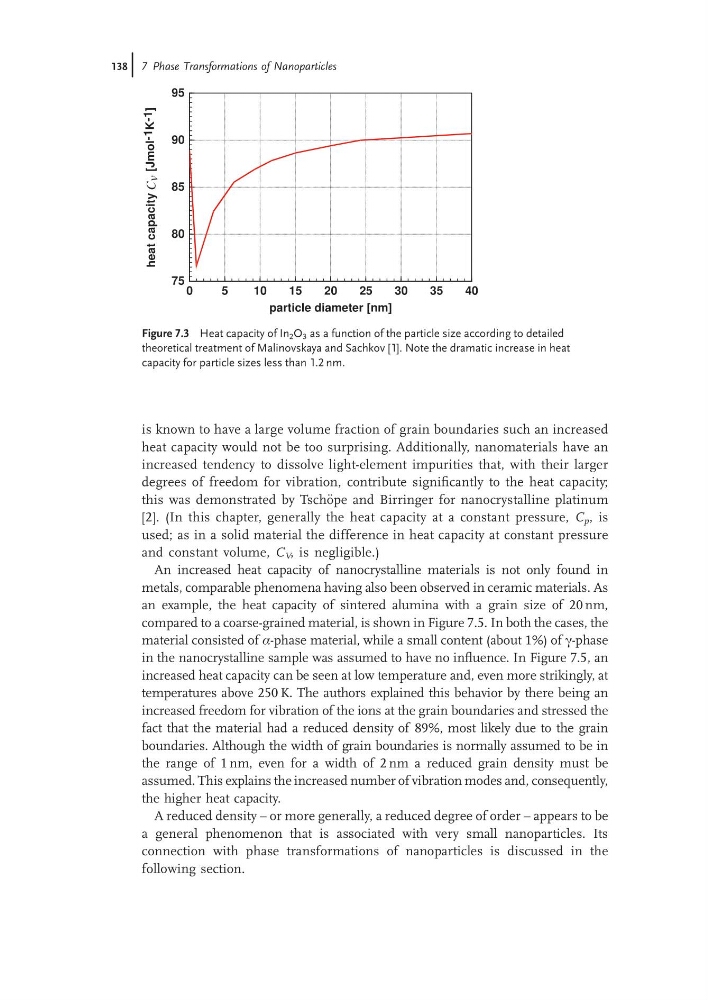
Figure 7.3 Heat capacity of In 2 O 3 as a function of the particle size according to detailed
theoretical treatment of Malinovskaya and Sachkov [1]. Note the dramatic increase in heat
capacity for particle sizes less than 1.2 nm.
138j 7 Phase Transformations of Nanoparticles
heat capacity would not be too surprising. Additionally, nanomaterials have an
increased tendency to dissolve light-element impurities that, with their larger
degrees of freedom for vibration, contribute significantly to the heat capacity;
this was demonstrated by Tsch€ ope and Birringer for nanocrystalline platinum
[2]. (In this chapter, generally the heat capacity at a constant pressure, C p , is
used; as in a solid material the difference in heat capacity at constant pressure
and constant volume, C V , is negligible.)
An increased heat capacity of nanocrystalline materials is not only found in
metals, comparable phenomena having also been observed in ceramic materials. As
an example, the heat capacity of sintered alumina with a grain size of 20 nm,
compared to a coarse-grained material, is shown in Figure 7.5. In both the cases, the
material consisted of a-phase material, while a small content (about 1%) of c-phase
in the nanocrystalline sample was assumed to have no influence. In Figure 7.5, an
increased heat capacity can be seen at low temperature and, even more strikingly, at
temperatures above 250 K. The authors explained this behavior by there being an
increased freedom for vibration of the ions at the grain boundaries and stressed the
fact that the material had a reduced density of 89%, most likely due to the grain
boundaries. Although the width of grain boundaries is normally assumed to be in
the range of 1 nm, even for a width of 2 nm a reduced grain density must be
assumed. This explains the increased number of vibration modes and, consequently,
the higher heat capacity.
A reduced density – or more generally, a reduced degree of order – appears to be
a general phenomenon that is associated with very small nanoparticles. Its
connection with phase transformations of nanoparticles is discussed in the
following section.
0
5
10
15
20
25
30
35
40
particle diameter [nm]
75
80
85
90
95
heat
capacity C v
[Jmol
-1 K
-1 ]
Figure 7.3 Heat capacity of In 2 O 3 as a function of the particle size according to detailed
theoretical treatment of Malinovskaya and Sachkov [1]. Note the dramatic increase in heat
capacity for particle sizes less than 1.2 nm.
138j 7 Phase Transformations of Nanoparticles