

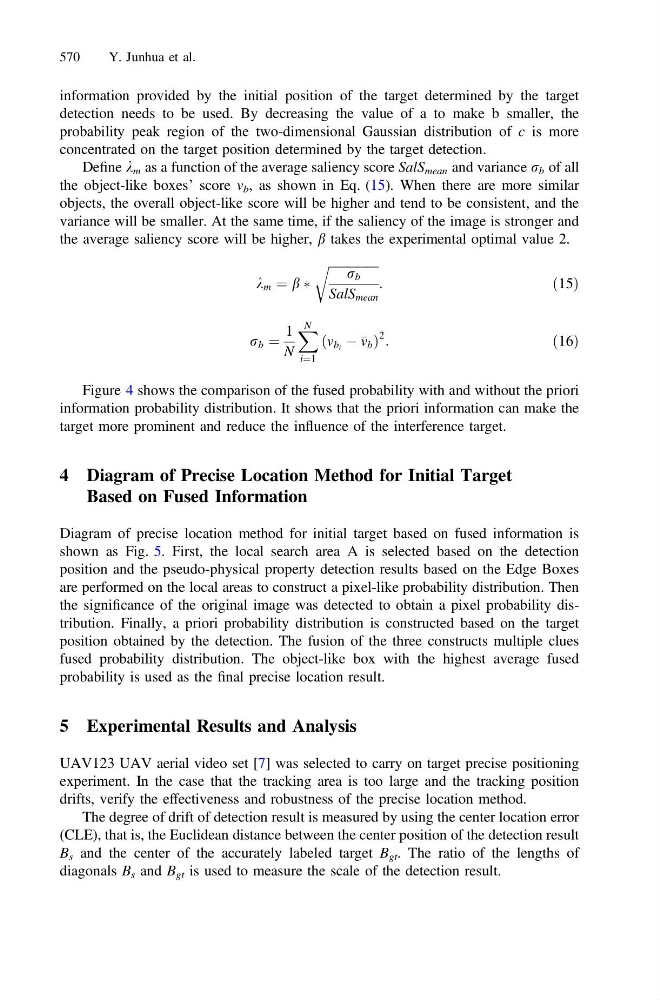
information provided by the initial position of the target determined by the target
detection needs to be used. By decreasing the value of a to make b smaller, the
probability peak region of the two-dimensional Gaussian distribution of c is more
concentrated on the target position determined by the target detection.
Define k m as a function of the average saliency score SalS mean and variance r b of all
the object-like boxes’ score v b , as shown in Eq. (15). When there are more similar
objects, the overall object-like score will be higher and tend to be consistent, and the
variance will be smaller. At the same time, if the saliency of the image is stronger and
the average saliency score will be higher, b takes the experimental optimal value 2.
k m ¼ b Ã
ffiffiffiffiffiffiffiffiffiffiffiffiffiffiffiffi
r b
SalS mean
r
:
ð15Þ
r b ¼
1
N
X N
i¼1
v b i À v b
ð
Þ
2 :
ð16Þ
Figure 4 shows the comparison of the fused probability with and without the priori
information probability distribution. It shows that the priori information can make the
target more prominent and reduce the influence of the interference target.
4 Diagram of Precise Location Method for Initial Target
Based on Fused Information
Diagram of precise location method for initial target based on fused information is
shown as Fig. 5. First, the local search area A is selected based on the detection
position and the pseudo-physical property detection results based on the Edge Boxes
are performed on the local areas to construct a pixel-like probability distribution. Then
the significance of the original image was detected to obtain a pixel probability distribution. Finally, a priori probability distribution is constructed based on the target
position obtained by the detection. The fusion of the three constructs multiple clues
fused probability distribution. The object-like box with the highest average fused
probability is used as the final precise location result.
5 Experimental Results and Analysis
UAV123 UAV aerial video set [7] was selected to carry on target precise positioning
experiment. In the case that the tracking area is too large and the tracking position
drifts, verify the effectiveness and robustness of the precise location method.
The degree of drift of detection result is measured by using the center location error
(CLE), that is, the Euclidean distance between the center position of the detection result
B s and the center of the accurately labeled target B gt . The ratio of the lengths of
diagonals B s and B gt is used to measure the scale of the detection result.
570
Y. Junhua et al.