

time series analysis method. Formula (6) is used to calculate the self-correlation
function.
q k ¼
P nÀk
i¼1 x i À x
ð
Þ x i þ k À x
ð
Þ
P n
i¼1 x i À x
ð
Þ
2
ð6Þ
Among them, k is the order of delay and n is the number of samples. If the value of
self-correlation function is 1 at zeros and close to 0 at other positions, it indicates that
the sequence is likely to be stationary and the distribution model of error sequence can
be established directly. If the value of self-correlation function is obviously not zero at
non-zeros, it indicates that the sequence is very likely to be non-stationary. This
requires increasing the sampling interval to reduce the correlation before establishing
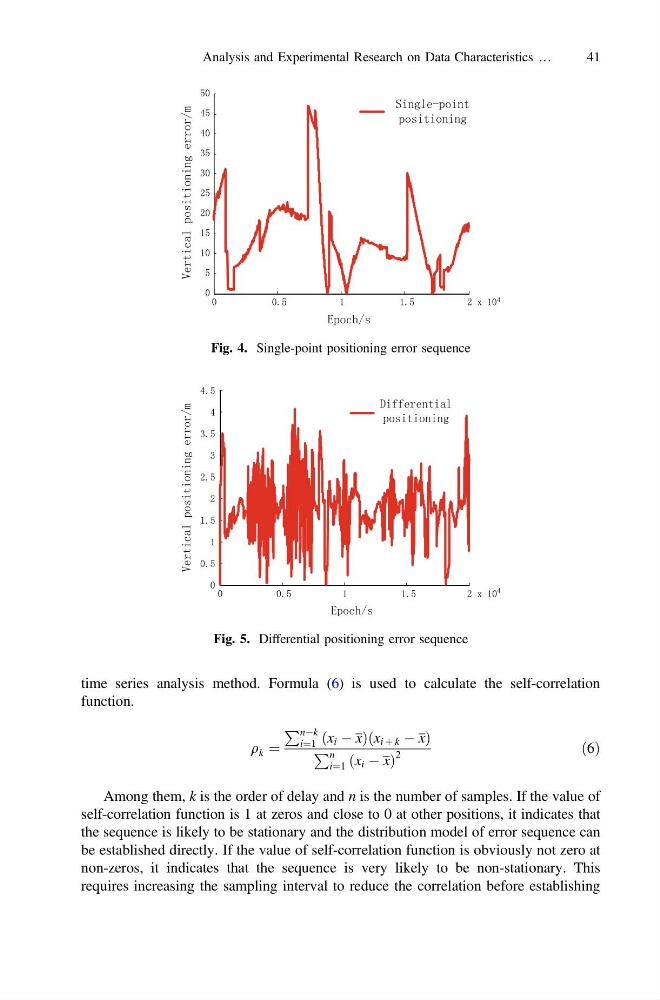
Fig. 4. Single-point positioning error sequence
Fig. 5. Differential positioning error sequence
Analysis and Experimental Research on Data Characteristics …
41
function.
q k ¼
P nÀk
i¼1 x i À x
ð
Þ x i þ k À x
ð
Þ
P n
i¼1 x i À x
ð
Þ
2
ð6Þ
Among them, k is the order of delay and n is the number of samples. If the value of
self-correlation function is 1 at zeros and close to 0 at other positions, it indicates that
the sequence is likely to be stationary and the distribution model of error sequence can
be established directly. If the value of self-correlation function is obviously not zero at
non-zeros, it indicates that the sequence is very likely to be non-stationary. This
requires increasing the sampling interval to reduce the correlation before establishing
Fig. 4. Single-point positioning error sequence
Fig. 5. Differential positioning error sequence
Analysis and Experimental Research on Data Characteristics …
41