

3.2 Discussion
First, this paper uses two deep learning methods for lung nodule CT data. Seven
methods were used to compare CNN-based pulmonary nodule-assisted diagnosis with
improved lung nodule-assisted diagnosis of CNN. Then, the classification of lung
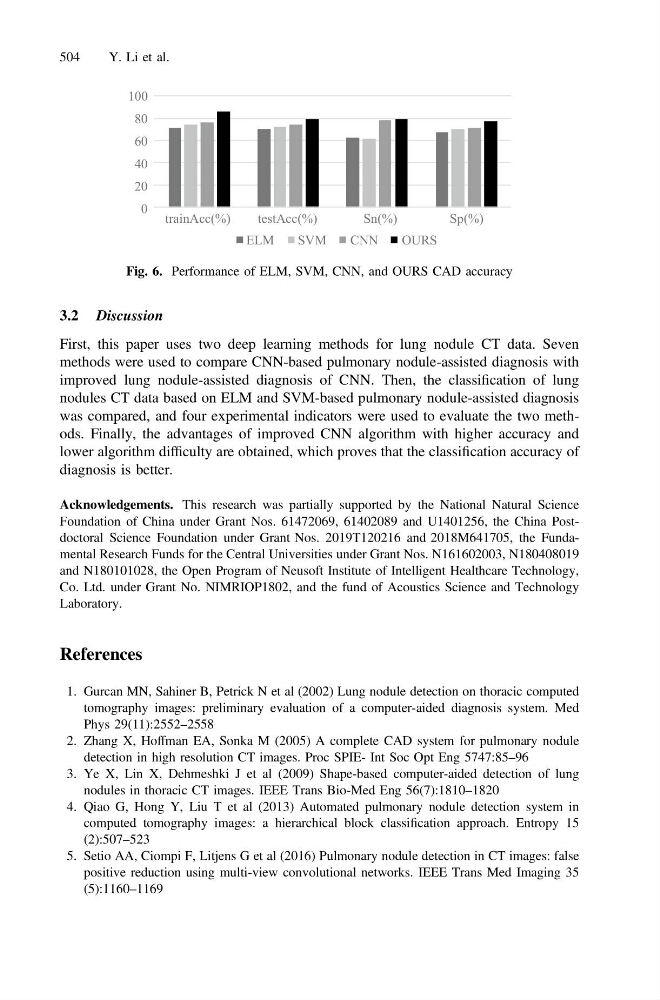
nodules CT data based on ELM and SVM-based pulmonary nodule-assisted diagnosis
was compared, and four experimental indicators were used to evaluate the two methods. Finally, the advantages of improved CNN algorithm with higher accuracy and
lower algorithm difficulty are obtained, which proves that the classification accuracy of
diagnosis is better.
Acknowledgements. This research was partially supported by the National Natural Science
Foundation of China under Grant Nos. 61472069, 61402089 and U1401256, the China Postdoctoral Science Foundation under Grant Nos. 2019T120216 and 2018M641705, the Fundamental Research Funds for the Central Universities under Grant Nos. N161602003, N180408019
and N180101028, the Open Program of Neusoft Institute of Intelligent Healthcare Technology,
Co. Ltd. under Grant No. NIMRIOP1802, and the fund of Acoustics Science and Technology
Laboratory.
References
1. Gurcan MN, Sahiner B, Petrick N et al (2002) Lung nodule detection on thoracic computed
tomography images: preliminary evaluation of a computer-aided diagnosis system. Med
Phys 29(11):2552–2558
2. Zhang X, Hoffman EA, Sonka M (2005) A complete CAD system for pulmonary nodule
detection in high resolution CT images. Proc SPIE- Int Soc Opt Eng 5747:85–96
3. Ye X, Lin X, Dehmeshki J et al (2009) Shape-based computer-aided detection of lung
nodules in thoracic CT images. IEEE Trans Bio-Med Eng 56(7):1810–1820
4. Qiao G, Hong Y, Liu T et al (2013) Automated pulmonary nodule detection system in
computed tomography images: a hierarchical block classification approach. Entropy 15
(2):507–523
5. Setio AA, Ciompi F, Litjens G et al (2016) Pulmonary nodule detection in CT images: false
positive reduction using multi-view convolutional networks. IEEE Trans Med Imaging 35
(5):1160–1169
0
20
40
60
80
100
trainAcc(%)
testAcc(%)
Sn(%)
Sp(%)
ELM
SVM
CNN
OURS
Fig. 6. Performance of ELM, SVM, CNN, and OURS CAD accuracy
504
Y. Li et al.