

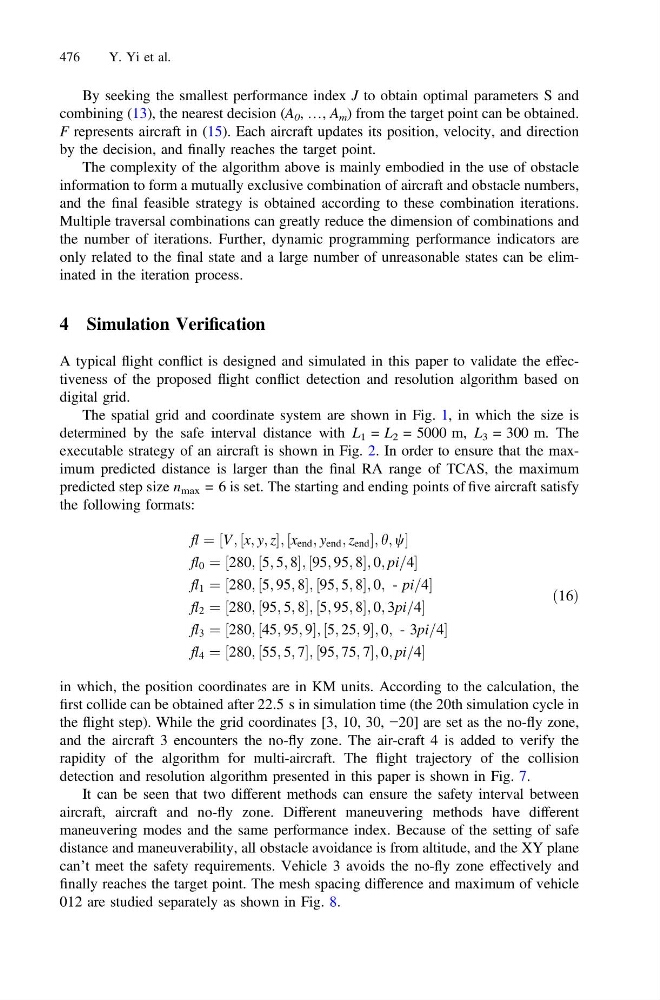
By seeking the smallest performance index J to obtain optimal parameters S and
combining (13), the nearest decision (A 0 , …, A m ) from the target point can be obtained.
F represents aircraft in (15). Each aircraft updates its position, velocity, and direction
by the decision, and finally reaches the target point.
The complexity of the algorithm above is mainly embodied in the use of obstacle
information to form a mutually exclusive combination of aircraft and obstacle numbers,
and the final feasible strategy is obtained according to these combination iterations.
Multiple traversal combinations can greatly reduce the dimension of combinations and
the number of iterations. Further, dynamic programming performance indicators are
only related to the final state and a large number of unreasonable states can be eliminated in the iteration process.
4 Simulation Verification
A typical flight conflict is designed and simulated in this paper to validate the effectiveness of the proposed flight conflict detection and resolution algorithm based on
digital grid.
The spatial grid and coordinate system are shown in Fig. 1, in which the size is
determined by the safe interval distance with L 1 = L 2 = 5000 m, L 3 = 300 m. The
executable strategy of an aircraft is shown in Fig. 2. In order to ensure that the maximum predicted distance is larger than the final RA range of TCAS, the maximum
predicted step size n max = 6 is set. The starting and ending points of five aircraft satisfy
the following formats:
fl ¼ ½V; ½x; y; z; ½x end ; y end ; z end ; h; w
fl 0 ¼ ½280; ½5; 5; 8; ½95; 95; 8; 0; pi=4
fl 1 ¼ ½280; ½5; 95; 8; ½95; 5; 8; 0; - pi=4
fl 2 ¼ ½280; ½95; 5; 8; ½5; 95; 8; 0; 3pi=4
fl 3 ¼ ½280; ½45; 95; 9; ½5; 25; 9; 0; - 3pi=4
fl 4 ¼ ½280; ½55; 5; 7; ½95; 75; 7; 0; pi=4
ð16Þ
in which, the position coordinates are in KM units. According to the calculation, the
first collide can be obtained after 22.5 s in simulation time (the 20th simulation cycle in
the flight step). While the grid coordinates [3, 10, 30, −20] are set as the no-fly zone,
and the aircraft 3 encounters the no-fly zone. The air-craft 4 is added to verify the
rapidity of the algorithm for multi-aircraft. The flight trajectory of the collision
detection and resolution algorithm presented in this paper is shown in Fig. 7.
It can be seen that two different methods can ensure the safety interval between
aircraft, aircraft and no-fly zone. Different maneuvering methods have different
maneuvering modes and the same performance index. Because of the setting of safe
distance and maneuverability, all obstacle avoidance is from altitude, and the XY plane
can’t meet the safety requirements. Vehicle 3 avoids the no-fly zone effectively and
finally reaches the target point. The mesh spacing difference and maximum of vehicle
012 are studied separately as shown in Fig. 8.
476
Y. Yi et al.